
Have your own idea? Try our Stock Screener
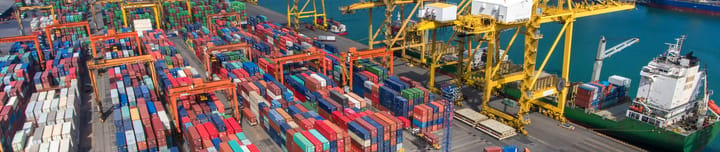
Emirati (ADX) Marine Ports and Services Industry Analysis
UpdatedJul 01, 2025
DataAggregated Company Financials
Companies1
- 7D9.4%
- 3M-6.2%
- 1Y-19.7%
- YTDn/a
Over the last 7 days, the Marine Ports and Services industry has dropped 3.1%, driven by pullbacks from every company within the industry. The industry has fallen 27% in the last year. Looking forward, earnings are forecast to grow by 14% annually.
Industry Valuation and Performance
Has the Emirati Marine Ports and Services Industry valuation changed over the past few years?
| Date | Market Cap | Revenue | Earnings | PE | Absolute PE | PS |
|---|---|---|---|---|---|---|
| Tue, 01 Jul 2025 | د.إ20.7b | د.إ18.0b | د.إ1.4b | 15.2x | 15.2x | 1.2x |
| Thu, 29 May 2025 | د.إ20.4b | د.إ18.0b | د.إ1.4b | 14.9x | 14.9x | 1.1x |
| Sat, 26 Apr 2025 | د.إ19.8b | د.إ17.3b | د.إ1.3b | 14.9x | 14.9x | 1.1x |
| Mon, 24 Mar 2025 | د.إ21.1b | د.إ17.3b | د.إ1.3b | 15.9x | 15.9x | 1.2x |
| Wed, 19 Feb 2025 | د.إ24.2b | د.إ17.3b | د.إ1.3b | 18.2x | 18.2x | 1.4x |
| Fri, 17 Jan 2025 | د.إ26.0b | د.إ16.3b | د.إ1.0b | 25.5x | 25.5x | 1.6x |
| Sun, 15 Dec 2024 | د.إ24.7b | د.إ16.3b | د.إ1.0b | 24.2x | 24.2x | 1.5x |
| Tue, 12 Nov 2024 | د.إ27.1b | د.إ15.9b | د.إ1.1b | 24.6x | 24.6x | 1.7x |
| Thu, 10 Oct 2024 | د.إ25.1b | د.إ15.9b | د.إ1.1b | 22.8x | 22.8x | 1.6x |
| Sat, 07 Sep 2024 | د.إ26.1b | د.إ15.9b | د.إ1.1b | 23.6x | 23.6x | 1.6x |
| Mon, 05 Aug 2024 | د.إ26.1b | د.إ13.7b | د.إ1.1b | 24.7x | 24.7x | 1.9x |
| Wed, 03 Jul 2024 | د.إ25.7b | د.إ13.7b | د.إ1.1b | 24.4x | 24.4x | 1.9x |
| Fri, 31 May 2024 | د.إ25.4b | د.إ13.7b | د.إ1.1b | 24.1x | 24.1x | 1.8x |
| Sun, 28 Apr 2024 | د.إ27.9b | د.إ11.7b | د.إ1.1b | 26x | 26x | 2.4x |
| Tue, 26 Mar 2024 | د.إ29.8b | د.إ11.7b | د.إ1.1b | 27.8x | 27.8x | 2.6x |
| Thu, 22 Feb 2024 | د.إ29.9b | د.إ11.7b | د.إ1.1b | 27.5x | 27.5x | 2.6x |
| Sat, 20 Jan 2024 | د.إ31.7b | د.إ9.9b | د.إ1.3b | 23.9x | 23.9x | 3.2x |
| Mon, 18 Dec 2023 | د.إ31.5b | د.إ9.9b | د.إ1.3b | 23.7x | 23.7x | 3.2x |
| Wed, 15 Nov 2023 | د.إ32.7b | د.إ7.1b | د.إ1.3b | 25.9x | 25.9x | 4.6x |
| Fri, 13 Oct 2023 | د.إ31.5b | د.إ7.1b | د.إ1.3b | 25x | 25x | 4.5x |
| Sun, 10 Sep 2023 | د.إ32.4b | د.إ7.1b | د.إ1.3b | 25.6x | 25.6x | 4.6x |
| Tue, 08 Aug 2023 | د.إ34.0b | د.إ6.3b | د.إ1.3b | 26.7x | 26.7x | 5.4x |
| Thu, 06 Jul 2023 | د.إ32.9b | د.إ6.3b | د.إ1.3b | 25.8x | 25.8x | 5.2x |
| Sat, 03 Jun 2023 | د.إ33.0b | د.إ6.3b | د.إ1.3b | 25.9x | 25.9x | 5.3x |
| Mon, 01 May 2023 | د.إ34.9b | د.إ5.5b | د.إ1.2b | 27.9x | 27.9x | 6.3x |
| Wed, 29 Mar 2023 | د.إ31.4b | د.إ5.5b | د.إ1.2b | 25.1x | 25.1x | 5.7x |
| Fri, 24 Feb 2023 | د.إ31.6b | د.إ5.5b | د.إ1.3b | 24.9x | 24.9x | 5.7x |
| Sun, 22 Jan 2023 | د.إ31.6b | د.إ4.9b | د.إ1.2b | 26.9x | 26.9x | 6.5x |
| Tue, 20 Dec 2022 | د.إ30.7b | د.إ4.9b | د.إ1.2b | 26.2x | 26.2x | 6.3x |
| Thu, 17 Nov 2022 | د.إ29.4b | د.إ4.9b | د.إ1.2b | 25.1x | 25.1x | 6x |
| Sat, 15 Oct 2022 | د.إ28.2b | د.إ4.4b | د.إ1.0b | 27x | 27x | 6.5x |
| Mon, 12 Sep 2022 | د.إ25.8b | د.إ4.4b | د.إ1.0b | 24.7x | 24.7x | 5.9x |
| Wed, 10 Aug 2022 | د.إ24.6b | د.إ3.9b | د.إ845.7m | 29.1x | 29.1x | 6.3x |
| Fri, 08 Jul 2022 | د.إ25.8b | د.إ3.9b | د.إ845.7m | 30.5x | 30.5x | 6.6x |
Price to Earnings Ratio
30.5x
Current Industry PE
- There is only one company in the Emirian Marine Ports and Services industry, so there is insufficient data to make an industry-wide assessment of both the PE and PS ratio.
Past Earnings Growth
- The earnings for companies in the Marine Ports and Services industry have grown 17% per year over the last three years.
- Revenues for these companies have grown 66% per year.
- This means that more sales are being generated by these companies overall, and subsequently their profits are increasing too.
Industry Comparison
How does Emirati Marine Ports and Services compare with similar industries?
| AE Market | 4.06% | |
| Industrials | 2.61% | |
| Infrastructure | 8.46% | |
| Marine Ports and Services | 9.41% | |
| Highways and Railtracks | 8.04% | |
Industry PEThere are no additional sub-industries under this industry.
Forecasted GrowthThere are no additional sub-industries under this industry.
Top Stock Gainers and Losers
Which companies have driven the market over the last 7 days?
| Company | Last Price | 7D | 1Y | Valuation | |
|---|---|---|---|---|---|
| ADPORTS Abu Dhabi Ports Company PJSC | د.إ4.07 | 9.4% +د.إ1.8b | -19.7% | PE15.2x |