- United States
- /
- Banks
- /
- NYSE:TFC
Elastic And Two Other Stocks Estimated To Be Trading Below Fair Value

Reviewed by Simply Wall St
The United States market has remained flat over the past week, yet it has experienced a 13% increase over the past year, with earnings projected to grow by 15% annually. In this context, identifying stocks that are trading below their fair value can be an effective strategy for investors seeking opportunities in a steadily improving market environment.
Top 10 Undervalued Stocks Based On Cash Flows In The United States
| Name | Current Price | Fair Value (Est) | Discount (Est) |
| Simulations Plus (SLP) | $16.83 | $32.76 | 48.6% |
| SharkNinja (SN) | $105.94 | $210.75 | 49.7% |
| Roku (ROKU) | $88.06 | $173.23 | 49.2% |
| Lyft (LYFT) | $16.07 | $31.20 | 48.5% |
| Hess Midstream (HESM) | $37.83 | $73.39 | 48.5% |
| Definitive Healthcare (DH) | $4.03 | $7.85 | 48.7% |
| Carter Bankshares (CARE) | $17.93 | $35.50 | 49.5% |
| Camden National (CAC) | $43.03 | $83.04 | 48.2% |
| BioLife Solutions (BLFS) | $21.81 | $42.50 | 48.7% |
| Atlantic Union Bankshares (AUB) | $33.01 | $65.54 | 49.6% |
Underneath we present a selection of stocks filtered out by our screen.
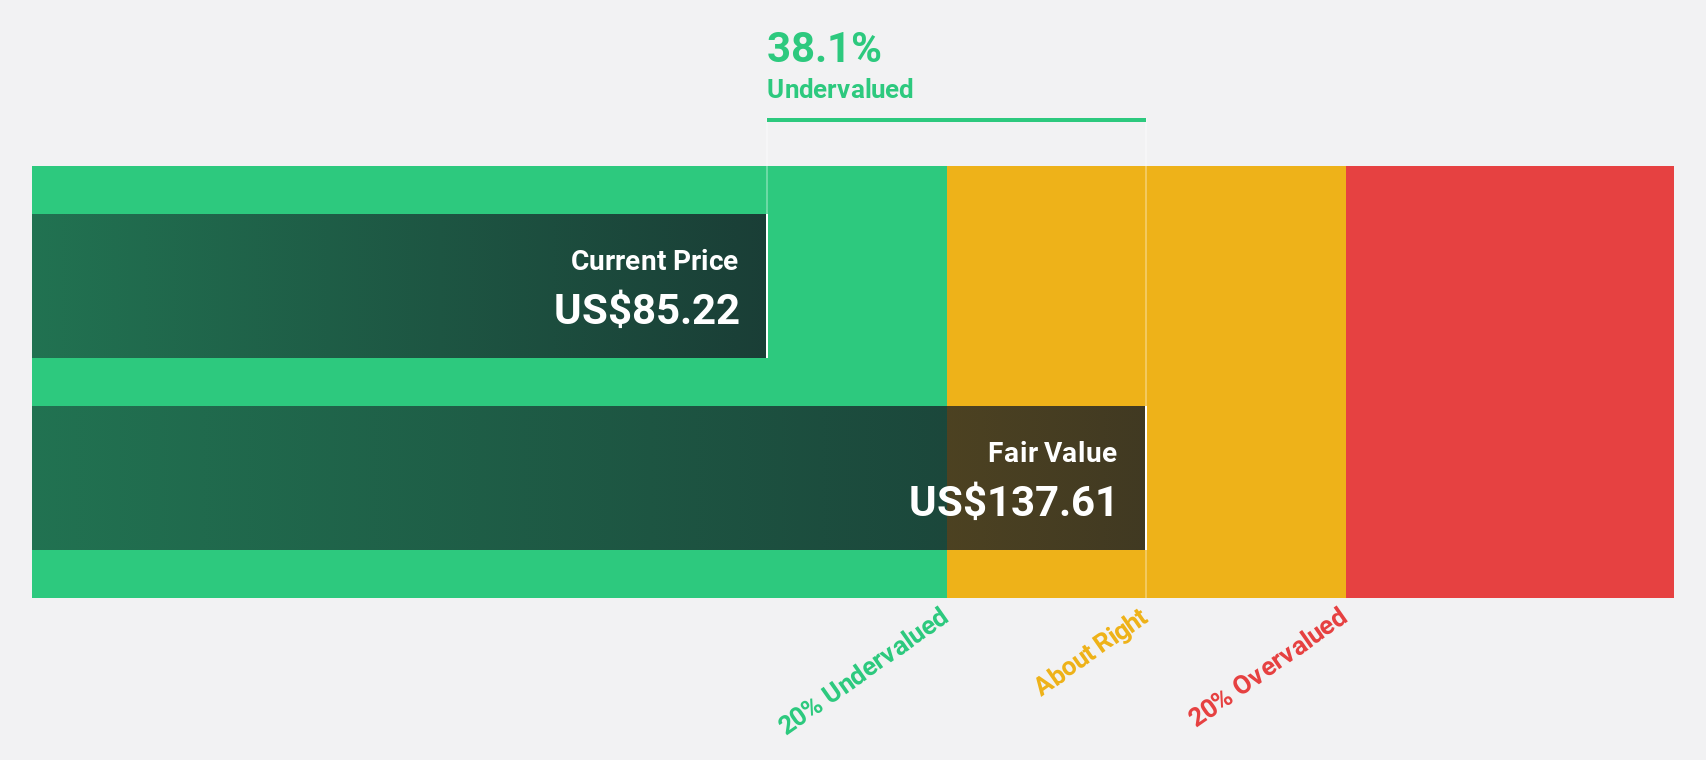
Elastic (ESTC)
Overview: Elastic N.V. is a search AI company that offers software platforms for hybrid, public, private, and multi-cloud environments globally, with a market cap of $9.21 billion.
Operations: The company's revenue primarily comes from its Software & Programming segment, which generated $1.48 billion.
Estimated Discount To Fair Value: 38.9%
Elastic, trading significantly below its estimated fair value of US$141.26 at US$86.28, exhibits potential as an undervalued stock based on cash flows. Despite a recent net loss of US$108.11 million for the fiscal year, forecasts indicate high earnings growth of 51.5% annually and a return to profitability within three years. The strategic collaboration with AWS aims to enhance AI capabilities and drive revenue growth projected at 11.3% per year, outpacing the broader U.S. market.
- Our earnings growth report unveils the potential for significant increases in Elastic's future results.
- Delve into the full analysis health report here for a deeper understanding of Elastic.
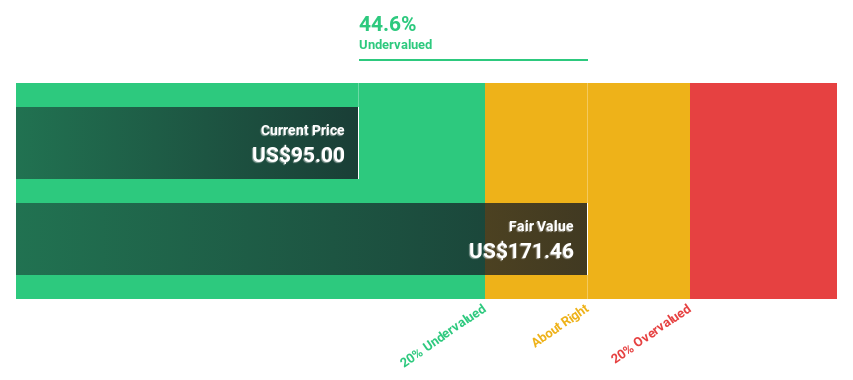
SouthState (SSB)
Overview: SouthState Corporation, with a market cap of approximately $9.83 billion, operates as the bank holding company for SouthState Bank, offering a variety of banking services and products to individuals and businesses in the United States.
Operations: The company's revenue is primarily derived from its Banking Operations segment, which generates approximately $1.83 billion.
Estimated Discount To Fair Value: 29.9%
SouthState is trading at US$95.94, below its estimated fair value of US$136.86, highlighting its potential as an undervalued stock based on cash flows. Despite recent index reclassifications and a decline in net income to US$89.08 million from the previous year, revenue growth is projected at 16.6% annually with earnings expected to rise significantly by 27.5% per year, surpassing market averages and supporting long-term investment appeal amidst strategic financial maneuvers like fixed-income offerings.
- The growth report we've compiled suggests that SouthState's future prospects could be on the up.
- Navigate through the intricacies of SouthState with our comprehensive financial health report here.
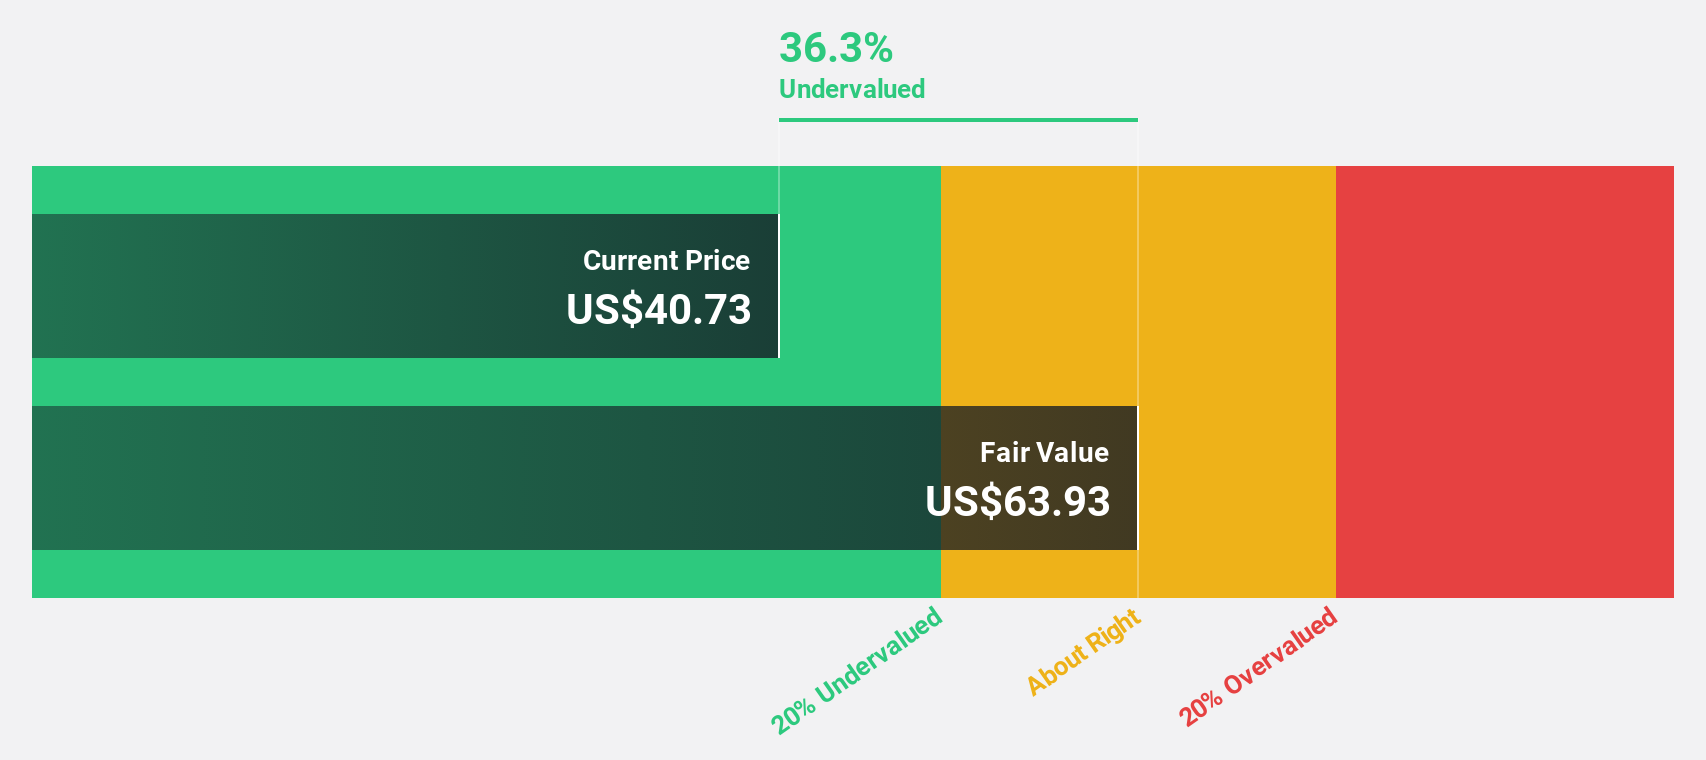
Truist Financial (TFC)
Overview: Truist Financial Corporation is a financial services company offering banking and trust services in the Southeastern and Mid-Atlantic United States, with a market cap of approximately $59.64 billion.
Operations: Truist Financial's revenue is primarily generated from its Consumer and Small Business Banking segment, which accounts for $11.04 billion, and its Wholesale Banking segment, contributing $10.12 billion.
Estimated Discount To Fair Value: 29.5%
Truist Financial, trading at US$45.16, is significantly undervalued compared to its estimated fair value of US$64.05, driven by robust cash flow potential. Recent strategic appointments aim to bolster its financial institutions and healthcare divisions while enhancing specialized industry services. Despite a dividend yield not fully covered by earnings, Truist's commitment to technological advancements and share buybacks underpins its growth strategy amidst forecasts for substantial profit increases over the next three years.
- Upon reviewing our latest growth report, Truist Financial's projected financial performance appears quite optimistic.
- Dive into the specifics of Truist Financial here with our thorough financial health report.
Key Takeaways
- Gain an insight into the universe of 175 Undervalued US Stocks Based On Cash Flows by clicking here.
- Have a stake in these businesses? Integrate your holdings into Simply Wall St's portfolio for notifications and detailed stock reports.
- Enhance your investing ability with the Simply Wall St app and enjoy free access to essential market intelligence spanning every continent.
Seeking Other Investments?
- Explore high-performing small cap companies that haven't yet garnered significant analyst attention.
- Diversify your portfolio with solid dividend payers offering reliable income streams to weather potential market turbulence.
- Fuel your portfolio with companies showing strong growth potential, backed by optimistic outlooks both from analysts and management.
This article by Simply Wall St is general in nature. We provide commentary based on historical data and analyst forecasts only using an unbiased methodology and our articles are not intended to be financial advice. It does not constitute a recommendation to buy or sell any stock, and does not take account of your objectives, or your financial situation. We aim to bring you long-term focused analysis driven by fundamental data. Note that our analysis may not factor in the latest price-sensitive company announcements or qualitative material. Simply Wall St has no position in any stocks mentioned.
The New Payments ETF Is Live on NASDAQ:
Money is moving to real-time rails, and a newly listed ETF now gives investors direct exposure. Fast settlement. Institutional custody. Simple access.
Explore how this launch could reshape portfolios
Sponsored ContentValuation is complex, but we're here to simplify it.
Discover if Truist Financial might be undervalued or overvalued with our detailed analysis, featuring fair value estimates, potential risks, dividends, insider trades, and its financial condition.
Access Free AnalysisHave feedback on this article? Concerned about the content? Get in touch with us directly. Alternatively, email editorial-team@simplywallst.com
About NYSE:TFC
Truist Financial
A financial services company, provides banking and trust services in the Southeastern and Mid-Atlantic United States.
Flawless balance sheet established dividend payer.
Similar Companies
Market Insights

Weekly Picks

Early mover in a fast growing industry. Likely to experience share price volatility as they scale


A case for CA$31.80 (undiluted), aka 8,616% upside from CA$0.37 (an 86 bagger!).


Moderation and Stabilisation: HOLD: Fair Price based on a 4-year Cycle is $12.08
Recently Updated Narratives


Title: Market Sentiment Is Dead Wrong — Here's Why PSEC Deserves a Second Look


An amazing opportunity to potentially get a 100 bagger

Amazon: Why the World’s Biggest Platform Still Runs on Invisible Economics
Popular Narratives


MicroVision will explode future revenue by 380.37% with a vision towards success


Crazy Undervalued 42 Baggers Silver Play (Active & Running Mine)


NVDA: Expanding AI Demand Will Drive Major Data Center Investments Through 2026
Trending Discussion
