
What trends should we look for it we want to identify stocks that can multiply in value over the long term? Firstly, we'd want to identify a growing return on capital employed (ROCE) and then alongside that, an ever-increasing base of capital employed. Ultimately, this demonstrates that it's a business that is reinvesting profits at increasing rates of return. So on that note, Trip.com Group (NASDAQ:TCOM) looks quite promising in regards to its trends of return on capital.
Understanding Return On Capital Employed (ROCE)
For those that aren't sure what ROCE is, it measures the amount of pre-tax profits a company can generate from the capital employed in its business. The formula for this calculation on Trip.com Group is:
Return on Capital Employed = Earnings Before Interest and Tax (EBIT) ÷ (Total Assets - Current Liabilities)
0.087 = CN¥12b ÷ (CN¥229b - CN¥87b) (Based on the trailing twelve months to March 2024).
Therefore, Trip.com Group has an ROCE of 8.7%. In absolute terms, that's a low return but it's around the Hospitality industry average of 10%.
View our latest analysis for Trip.com Group
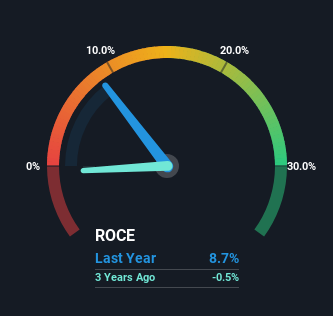
In the above chart we have measured Trip.com Group's prior ROCE against its prior performance, but the future is arguably more important. If you're interested, you can view the analysts predictions in our free analyst report for Trip.com Group .
How Are Returns Trending?
Trip.com Group has not disappointed with their ROCE growth. The figures show that over the last five years, ROCE has grown 273% whilst employing roughly the same amount of capital. Basically the business is generating higher returns from the same amount of capital and that is proof that there are improvements in the company's efficiencies. It's worth looking deeper into this though because while it's great that the business is more efficient, it might also mean that going forward the areas to invest internally for the organic growth are lacking.
In Conclusion...
To bring it all together, Trip.com Group has done well to increase the returns it's generating from its capital employed. Since the stock has only returned 36% to shareholders over the last five years, the promising fundamentals may not be recognized yet by investors. So exploring more about this stock could uncover a good opportunity, if the valuation and other metrics stack up.
On the other side of ROCE, we have to consider valuation. That's why we have a FREE intrinsic value estimation for TCOM on our platform that is definitely worth checking out.
While Trip.com Group isn't earning the highest return, check out this free list of companies that are earning high returns on equity with solid balance sheets.
The New Payments ETF Is Live on NASDAQ:
Money is moving to real-time rails, and a newly listed ETF now gives investors direct exposure. Fast settlement. Institutional custody. Simple access.
Explore how this launch could reshape portfolios
Sponsored ContentValuation is complex, but we're here to simplify it.
Discover if Trip.com Group might be undervalued or overvalued with our detailed analysis, featuring fair value estimates, potential risks, dividends, insider trades, and its financial condition.
Access Free AnalysisHave feedback on this article? Concerned about the content? Get in touch with us directly. Alternatively, email editorial-team (at) simplywallst.com.
This article by Simply Wall St is general in nature. We provide commentary based on historical data and analyst forecasts only using an unbiased methodology and our articles are not intended to be financial advice. It does not constitute a recommendation to buy or sell any stock, and does not take account of your objectives, or your financial situation. We aim to bring you long-term focused analysis driven by fundamental data. Note that our analysis may not factor in the latest price-sensitive company announcements or qualitative material. Simply Wall St has no position in any stocks mentioned.
Have feedback on this article? Concerned about the content? Get in touch with us directly. Alternatively, email editorial-team@simplywallst.com
About NasdaqGS:TCOM
Trip.com Group
Through its subsidiaries, operates as a travel service provider for accommodation reservation, transportation ticketing, packaged tours, in-destination, corporate travel management, and other travel-related services in China and internationally.
Very undervalued with flawless balance sheet.
Similar Companies
Market Insights

Weekly Picks

THE KINGDOM OF BROWN GOODS: WHY MGPI IS BEING CRUSHED BY INVENTORY & PRIMED FOR RESURRECTION


Why Vertical Aerospace (NYSE: EVTL) is Worth Possibly Over 13x its Current Price


The Quiet Giant That Became AI’s Power Grid
Recently Updated Narratives

Butler National (Buks) outperforms.


A tech powerhouse quietly powering the world’s AI infrastructure.


Keppel DC REIT (SGX: AJBU) is a resilient gem in the data center space.
Popular Narratives

MicroVision will explode future revenue by 380.37% with a vision towards success


Crazy Undervalued 42 Baggers Silver Play (Active & Running Mine)


