- United States
- /
- Hospitality
- /
- NasdaqGS:FWRG
Calculating The Fair Value Of First Watch Restaurant Group, Inc. (NASDAQ:FWRG)

Key Insights
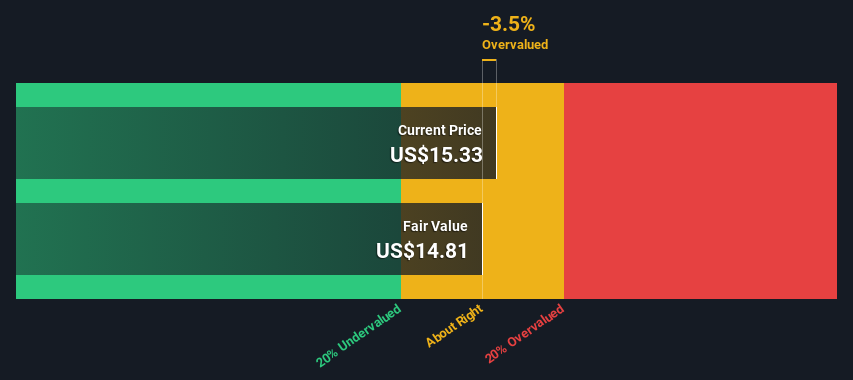
- First Watch Restaurant Group's estimated fair value is US$14.81 based on 2 Stage Free Cash Flow to Equity
- Current share price of US$15.33 suggests First Watch Restaurant Group is potentially trading close to its fair value
- The US$23.40 analyst price target for FWRG is 58% more than our estimate of fair value
Today we'll do a simple run through of a valuation method used to estimate the attractiveness of First Watch Restaurant Group, Inc. (NASDAQ:FWRG) as an investment opportunity by taking the forecast future cash flows of the company and discounting them back to today's value. Our analysis will employ the Discounted Cash Flow (DCF) model. There's really not all that much to it, even though it might appear quite complex.
Companies can be valued in a lot of ways, so we would point out that a DCF is not perfect for every situation. If you want to learn more about discounted cash flow, the rationale behind this calculation can be read in detail in the Simply Wall St analysis model.
We've discovered 3 warning signs about First Watch Restaurant Group. View them for free.Step By Step Through The Calculation
We use what is known as a 2-stage model, which simply means we have two different periods of growth rates for the company's cash flows. Generally the first stage is higher growth, and the second stage is a lower growth phase. To begin with, we have to get estimates of the next ten years of cash flows. Where possible we use analyst estimates, but when these aren't available we extrapolate the previous free cash flow (FCF) from the last estimate or reported value. We assume companies with shrinking free cash flow will slow their rate of shrinkage, and that companies with growing free cash flow will see their growth rate slow, over this period. We do this to reflect that growth tends to slow more in the early years than it does in later years.
A DCF is all about the idea that a dollar in the future is less valuable than a dollar today, and so the sum of these future cash flows is then discounted to today's value:
10-year free cash flow (FCF) forecast
| 2025 | 2026 | 2027 | 2028 | 2029 | 2030 | 2031 | 2032 | 2033 | 2034 | |
| Levered FCF ($, Millions) | -US$38.4m | -US$19.9m | US$23.3m | US$30.1m | US$47.2m | US$61.1m | US$74.1m | US$85.8m | US$96.0m | US$104.8m |
| Growth Rate Estimate Source | Analyst x2 | Analyst x2 | Analyst x1 | Analyst x1 | Analyst x1 | Est @ 29.32% | Est @ 21.35% | Est @ 15.77% | Est @ 11.86% | Est @ 9.13% |
| Present Value ($, Millions) Discounted @ 9.3% | -US$35.2 | -US$16.7 | US$17.9 | US$21.1 | US$30.3 | US$35.9 | US$39.9 | US$42.2 | US$43.2 | US$43.2 |
("Est" = FCF growth rate estimated by Simply Wall St)
Present Value of 10-year Cash Flow (PVCF) = US$222m
We now need to calculate the Terminal Value, which accounts for all the future cash flows after this ten year period. The Gordon Growth formula is used to calculate Terminal Value at a future annual growth rate equal to the 5-year average of the 10-year government bond yield of 2.8%. We discount the terminal cash flows to today's value at a cost of equity of 9.3%.
Terminal Value (TV)= FCF2034 × (1 + g) ÷ (r – g) = US$105m× (1 + 2.8%) ÷ (9.3%– 2.8%) = US$1.7b
Present Value of Terminal Value (PVTV)= TV / (1 + r)10= US$1.7b÷ ( 1 + 9.3%)10= US$681m
The total value is the sum of cash flows for the next ten years plus the discounted terminal value, which results in the Total Equity Value, which in this case is US$903m. In the final step we divide the equity value by the number of shares outstanding. Relative to the current share price of US$15.3, the company appears around fair value at the time of writing. Valuations are imprecise instruments though, rather like a telescope - move a few degrees and end up in a different galaxy. Do keep this in mind.
Important Assumptions
The calculation above is very dependent on two assumptions. The first is the discount rate and the other is the cash flows. If you don't agree with these result, have a go at the calculation yourself and play with the assumptions. The DCF also does not consider the possible cyclicality of an industry, or a company's future capital requirements, so it does not give a full picture of a company's potential performance. Given that we are looking at First Watch Restaurant Group as potential shareholders, the cost of equity is used as the discount rate, rather than the cost of capital (or weighted average cost of capital, WACC) which accounts for debt. In this calculation we've used 9.3%, which is based on a levered beta of 1.505. Beta is a measure of a stock's volatility, compared to the market as a whole. We get our beta from the industry average beta of globally comparable companies, with an imposed limit between 0.8 and 2.0, which is a reasonable range for a stable business.
View our latest analysis for First Watch Restaurant Group
SWOT Analysis for First Watch Restaurant Group
- Debt is well covered by cash flow.
- Earnings declined over the past year.
- Interest payments on debt are not well covered.
- Expensive based on P/E ratio and estimated fair value.
- Annual earnings are forecast to grow faster than the American market.
- Revenue is forecast to grow slower than 20% per year.
Moving On:
Valuation is only one side of the coin in terms of building your investment thesis, and it ideally won't be the sole piece of analysis you scrutinize for a company. It's not possible to obtain a foolproof valuation with a DCF model. Instead the best use for a DCF model is to test certain assumptions and theories to see if they would lead to the company being undervalued or overvalued. If a company grows at a different rate, or if its cost of equity or risk free rate changes sharply, the output can look very different. For First Watch Restaurant Group, there are three relevant aspects you should further research:
- Risks: Every company has them, and we've spotted 3 warning signs for First Watch Restaurant Group you should know about.
- Management:Have insiders been ramping up their shares to take advantage of the market's sentiment for FWRG's future outlook? Check out our management and board analysis with insights on CEO compensation and governance factors.
- Other Solid Businesses: Low debt, high returns on equity and good past performance are fundamental to a strong business. Why not explore our interactive list of stocks with solid business fundamentals to see if there are other companies you may not have considered!
PS. The Simply Wall St app conducts a discounted cash flow valuation for every stock on the NASDAQGS every day. If you want to find the calculation for other stocks just search here.
The New Payments ETF Is Live on NASDAQ:
Money is moving to real-time rails, and a newly listed ETF now gives investors direct exposure. Fast settlement. Institutional custody. Simple access.
Explore how this launch could reshape portfolios
Sponsored ContentNew: AI Stock Screener & Alerts
Our new AI Stock Screener scans the market every day to uncover opportunities.
• Dividend Powerhouses (3%+ Yield)
• Undervalued Small Caps with Insider Buying
• High growth Tech and AI Companies
Or build your own from over 50 metrics.
Have feedback on this article? Concerned about the content? Get in touch with us directly. Alternatively, email editorial-team (at) simplywallst.com.
This article by Simply Wall St is general in nature. We provide commentary based on historical data and analyst forecasts only using an unbiased methodology and our articles are not intended to be financial advice. It does not constitute a recommendation to buy or sell any stock, and does not take account of your objectives, or your financial situation. We aim to bring you long-term focused analysis driven by fundamental data. Note that our analysis may not factor in the latest price-sensitive company announcements or qualitative material. Simply Wall St has no position in any stocks mentioned.
About NasdaqGS:FWRG
First Watch Restaurant Group
Through its subsidiaries, operates and franchises restaurants under the First Watch trade name in the United States.
Good value with reasonable growth potential.
Market Insights

Weekly Picks

THE KINGDOM OF BROWN GOODS: WHY MGPI IS BEING CRUSHED BY INVENTORY & PRIMED FOR RESURRECTION


Why Vertical Aerospace (NYSE: EVTL) is Worth Possibly Over 13x its Current Price


The Quiet Giant That Became AI’s Power Grid
Recently Updated Narratives


A case for USD $14.81 per share based on book value. Be warned, this is a micro-cap dependent on a single mine.

Occidental Petroleum to Become Fairly Priced at $68.29 According to Future Projections

Agfa-Gevaert is a digital and materials turnaround opportunity, with growth potential in ZIRFON, but carrying legacy risks.
Popular Narratives


MicroVision will explode future revenue by 380.37% with a vision towards success


Crazy Undervalued 42 Baggers Silver Play (Active & Running Mine)


