- United States
- /
- Professional Services
- /
- NYSE:TRU
Revenues Not Telling The Story For TransUnion (NYSE:TRU) After Shares Rise 25%

TransUnion (NYSE:TRU) shareholders have had their patience rewarded with a 25% share price jump in the last month. Taking a wider view, although not as strong as the last month, the full year gain of 23% is also fairly reasonable.
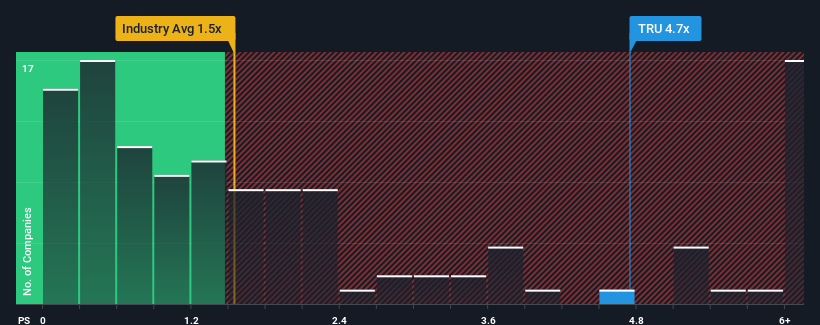
After such a large jump in price, you could be forgiven for thinking TransUnion is a stock to steer clear of with a price-to-sales ratios (or "P/S") of 4.7x, considering almost half the companies in the United States' Professional Services industry have P/S ratios below 1.5x. However, the P/S might be quite high for a reason and it requires further investigation to determine if it's justified.
See our latest analysis for TransUnion

What Does TransUnion's P/S Mean For Shareholders?
TransUnion's revenue growth of late has been pretty similar to most other companies. Perhaps the market is expecting future revenue performance to improve, justifying the currently elevated P/S. If not, then existing shareholders may be a little nervous about the viability of the share price.
If you'd like to see what analysts are forecasting going forward, you should check out our free report on TransUnion.What Are Revenue Growth Metrics Telling Us About The High P/S?
TransUnion's P/S ratio would be typical for a company that's expected to deliver very strong growth, and importantly, perform much better than the industry.
Retrospectively, the last year delivered a decent 6.3% gain to the company's revenues. This was backed up an excellent period prior to see revenue up by 51% in total over the last three years. So we can start by confirming that the company has done a great job of growing revenues over that time.
Turning to the outlook, the next three years should generate growth of 8.4% per year as estimated by the analysts watching the company. With the industry predicted to deliver 7.2% growth each year, the company is positioned for a comparable revenue result.
In light of this, it's curious that TransUnion's P/S sits above the majority of other companies. It seems most investors are ignoring the fairly average growth expectations and are willing to pay up for exposure to the stock. Although, additional gains will be difficult to achieve as this level of revenue growth is likely to weigh down the share price eventually.
What We Can Learn From TransUnion's P/S?
The strong share price surge has lead to TransUnion's P/S soaring as well. While the price-to-sales ratio shouldn't be the defining factor in whether you buy a stock or not, it's quite a capable barometer of revenue expectations.
Seeing as its revenues are forecast to grow in line with the wider industry, it would appear that TransUnion currently trades on a higher than expected P/S. The fact that the revenue figures aren't setting the world alight has us doubtful that the company's elevated P/S can be sustainable for the long term. A positive change is needed in order to justify the current price-to-sales ratio.
Don't forget that there may be other risks. For instance, we've identified 2 warning signs for TransUnion (1 is significant) you should be aware of.
If strong companies turning a profit tickle your fancy, then you'll want to check out this free list of interesting companies that trade on a low P/E (but have proven they can grow earnings).
Valuation is complex, but we're here to simplify it.
Discover if TransUnion might be undervalued or overvalued with our detailed analysis, featuring fair value estimates, potential risks, dividends, insider trades, and its financial condition.
Access Free AnalysisHave feedback on this article? Concerned about the content? Get in touch with us directly. Alternatively, email editorial-team (at) simplywallst.com.
This article by Simply Wall St is general in nature. We provide commentary based on historical data and analyst forecasts only using an unbiased methodology and our articles are not intended to be financial advice. It does not constitute a recommendation to buy or sell any stock, and does not take account of your objectives, or your financial situation. We aim to bring you long-term focused analysis driven by fundamental data. Note that our analysis may not factor in the latest price-sensitive company announcements or qualitative material. Simply Wall St has no position in any stocks mentioned.
About NYSE:TRU
TransUnion
Operates as a global consumer credit reporting agency that provides risk and information solutions.
Reasonable growth potential and fair value.
Similar Companies
Market Insights
Community Narratives


