
Advertisement
Warren Buffett famously said, 'Volatility is far from synonymous with risk.' So it might be obvious that you need to consider debt, when you think about how risky any given stock is, because too much debt can sink a company. As with many other companies TransUnion (NYSE:TRU) makes use of debt. But the more important question is: how much risk is that debt creating?
When Is Debt A Problem?
Debt is a tool to help businesses grow, but if a business is incapable of paying off its lenders, then it exists at their mercy. In the worst case scenario, a company can go bankrupt if it cannot pay its creditors. However, a more common (but still painful) scenario is that it has to raise new equity capital at a low price, thus permanently diluting shareholders. Of course, the upside of debt is that it often represents cheap capital, especially when it replaces dilution in a company with the ability to reinvest at high rates of return. When we examine debt levels, we first consider both cash and debt levels, together.
See our latest analysis for TransUnion
What Is TransUnion's Debt?
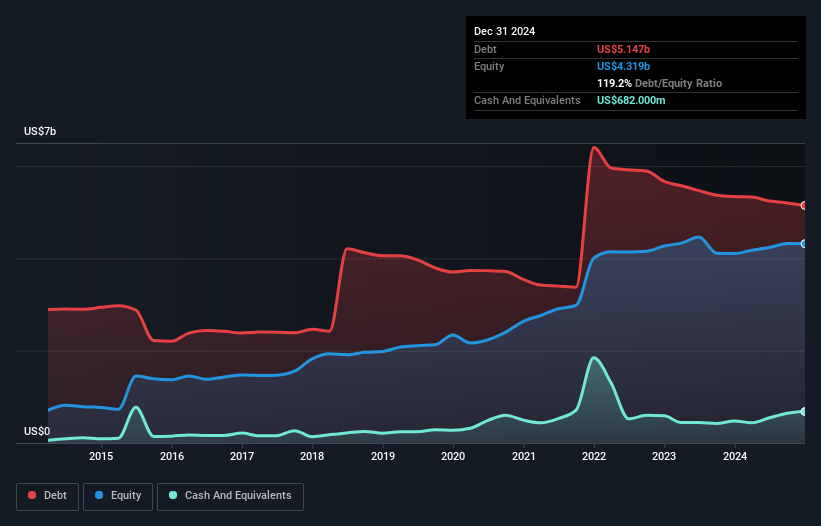
As you can see below, TransUnion had US$5.15b of debt, at December 2024, which is about the same as the year before. You can click the chart for greater detail. However, it also had US$682.0m in cash, and so its net debt is US$4.47b.
How Healthy Is TransUnion's Balance Sheet?
According to the last reported balance sheet, TransUnion had liabilities of US$1.06b due within 12 months, and liabilities of US$5.61b due beyond 12 months. Offsetting this, it had US$682.0m in cash and US$888.6m in receivables that were due within 12 months. So its liabilities outweigh the sum of its cash and (near-term) receivables by US$5.10b.
TransUnion has a very large market capitalization of US$18.0b, so it could very likely raise cash to ameliorate its balance sheet, if the need arose. But it's clear that we should definitely closely examine whether it can manage its debt without dilution.
We use two main ratios to inform us about debt levels relative to earnings. The first is net debt divided by earnings before interest, tax, depreciation, and amortization (EBITDA), while the second is how many times its earnings before interest and tax (EBIT) covers its interest expense (or its interest cover, for short). The advantage of this approach is that we take into account both the absolute quantum of debt (with net debt to EBITDA) and the actual interest expenses associated with that debt (with its interest cover ratio).
TransUnion's debt is 3.5 times its EBITDA, and its EBIT cover its interest expense 3.1 times over. This suggests that while the debt levels are significant, we'd stop short of calling them problematic. However, one redeeming factor is that TransUnion grew its EBIT at 19% over the last 12 months, boosting its ability to handle its debt. There's no doubt that we learn most about debt from the balance sheet. But ultimately the future profitability of the business will decide if TransUnion can strengthen its balance sheet over time. So if you want to see what the professionals think, you might find this free report on analyst profit forecasts to be interesting.
Finally, a business needs free cash flow to pay off debt; accounting profits just don't cut it. So the logical step is to look at the proportion of that EBIT that is matched by actual free cash flow. In the last three years, TransUnion's free cash flow amounted to 42% of its EBIT, less than we'd expect. That's not great, when it comes to paying down debt.
Our View
When it comes to the balance sheet, the standout positive for TransUnion was the fact that it seems able to grow its EBIT confidently. However, our other observations weren't so heartening. For example, its interest cover makes us a little nervous about its debt. Looking at all this data makes us feel a little cautious about TransUnion's debt levels. While we appreciate debt can enhance returns on equity, we'd suggest that shareholders keep close watch on its debt levels, lest they increase. When analysing debt levels, the balance sheet is the obvious place to start. But ultimately, every company can contain risks that exist outside of the balance sheet. To that end, you should learn about the 2 warning signs we've spotted with TransUnion (including 1 which is significant) .
If you're interested in investing in businesses that can grow profits without the burden of debt, then check out this free list of growing businesses that have net cash on the balance sheet.
Valuation is complex, but we're here to simplify it.
Discover if TransUnion might be undervalued or overvalued with our detailed analysis, featuring fair value estimates, potential risks, dividends, insider trades, and its financial condition.
Access Free AnalysisHave feedback on this article? Concerned about the content? Get in touch with us directly. Alternatively, email editorial-team (at) simplywallst.com.
This article by Simply Wall St is general in nature. We provide commentary based on historical data and analyst forecasts only using an unbiased methodology and our articles are not intended to be financial advice. It does not constitute a recommendation to buy or sell any stock, and does not take account of your objectives, or your financial situation. We aim to bring you long-term focused analysis driven by fundamental data. Note that our analysis may not factor in the latest price-sensitive company announcements or qualitative material. Simply Wall St has no position in any stocks mentioned.
About NYSE:TRU
TransUnion
Operates as a global consumer credit reporting agency that provides risk and information solutions.
Fair value with moderate growth potential.
Similar Companies
Market Insights


Advertisement
Community Narratives
America Wants Homegrown Drones — Draganfly Is Ready to Deliver
Fair Value US$9.21|27.4% undervalued
JO
Community Contributor
Cheesecake Factory offers an enticing opportunity for long-term growth by leveraging new concepts
Fair Value US$73.83|25.8% undervalued
ZW
Community Contributor
Coca-Cola’s Intrinsic Value Set to Rise with Fed Rate Cut
Fair Value US$67.50|2.7% undervalued
AL
Community Contributor
Fully Permitted Gold Mine with 50 Baggers Potential 
Fair Value CA$41.00|98.0% undervalued
RO
Community Contributor