Advertisement
- United States
- /
- Banks
- /
- NasdaqGS:FITB
Discovering Three Top Dividend Stocks
As major stock indexes in the United States close higher, rebounding from a recent losing streak, investors are keeping a keen eye on potential market shifts amid looming economic uncertainties like the government shutdown deadline. In such an environment, dividend stocks can offer stability and income potential, making them an attractive choice for those looking to balance growth with reliable returns.
Top 10 Dividend Stocks In The United States
| Name | Dividend Yield | Dividend Rating |
| Rayonier (RYN) | 10.97% | ★★★★★☆ |
| Peoples Bancorp (PEBO) | 5.48% | ★★★★★☆ |
| OceanFirst Financial (OCFC) | 4.55% | ★★★★★★ |
| First Interstate BancSystem (FIBK) | 5.85% | ★★★★★★ |
| Ennis (EBF) | 5.52% | ★★★★★★ |
| Employers Holdings (EIG) | 3.05% | ★★★★★☆ |
| Douglas Dynamics (PLOW) | 3.79% | ★★★★★☆ |
| Columbia Banking System (COLB) | 5.61% | ★★★★★★ |
| Citizens & Northern (CZNC) | 5.68% | ★★★★★☆ |
| Banco Latinoamericano de Comercio Exterior S. A (BLX) | 5.40% | ★★★★★☆ |
Click here to see the full list of 126 stocks from our Top US Dividend Stocks screener.
Here we highlight a subset of our preferred stocks from the screener.
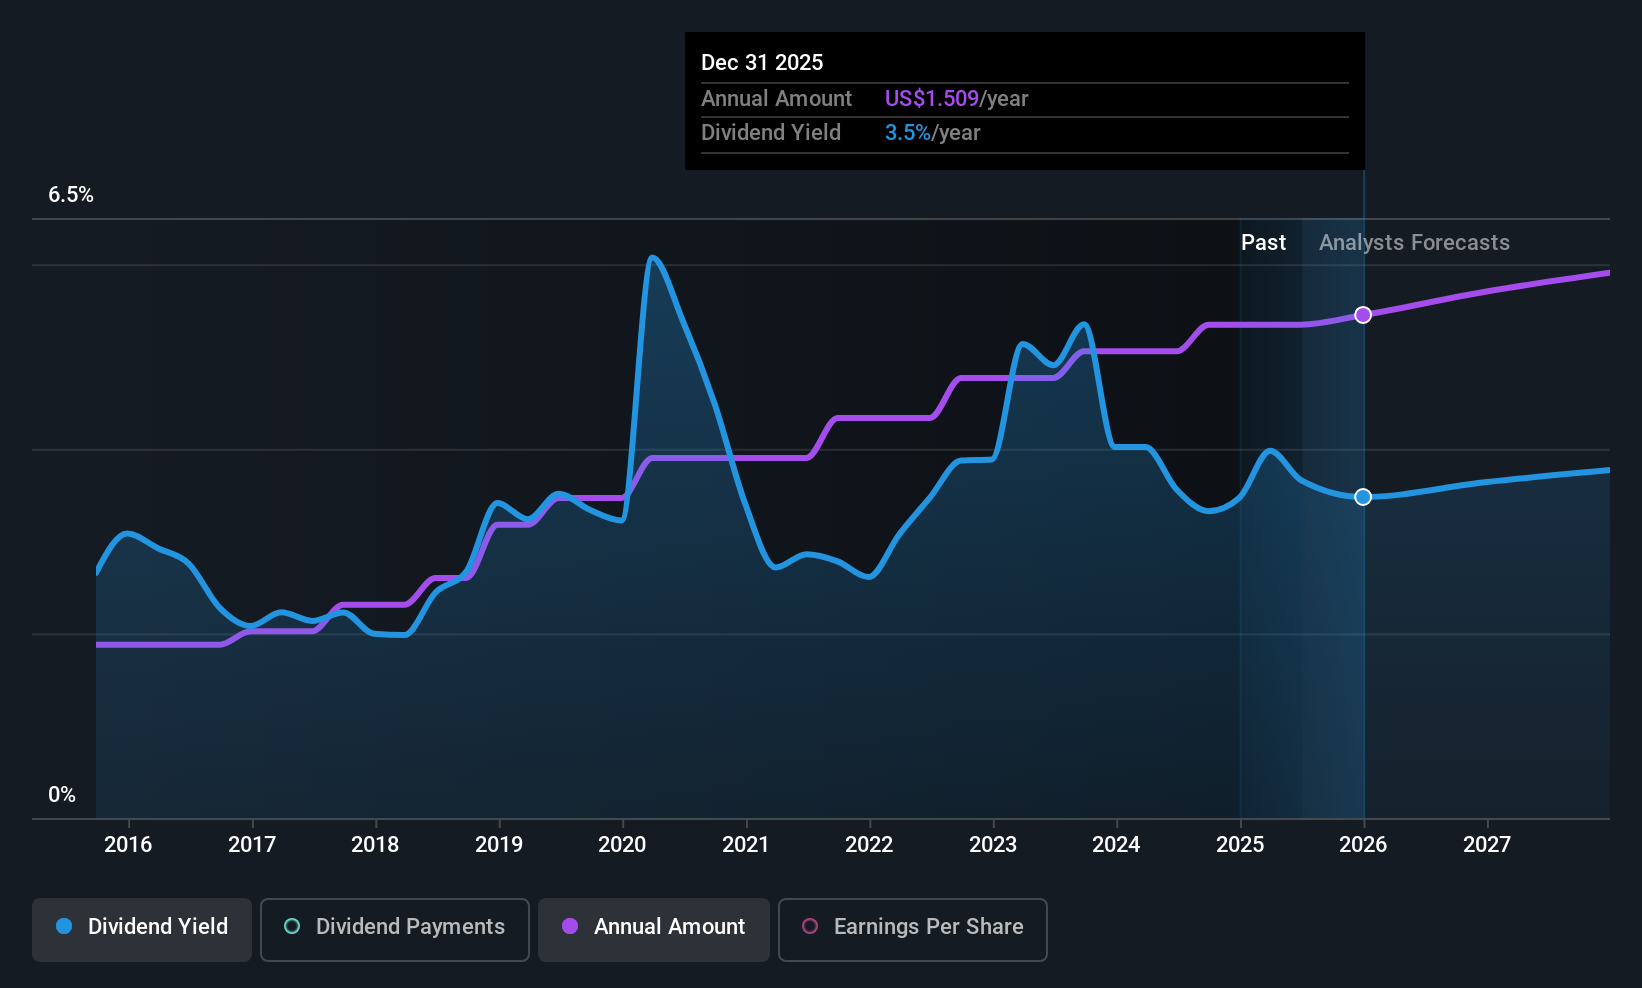
Fifth Third Bancorp (FITB)
Simply Wall St Dividend Rating: ★★★★★☆
Overview: Fifth Third Bancorp is a bank holding company for Fifth Third Bank, National Association, providing a variety of financial products and services across the United States with a market cap of approximately $30.07 billion.
Operations: Fifth Third Bancorp generates revenue primarily through its Consumer and Small Business Banking segment ($4.78 billion), Commercial Banking segment ($3.59 billion), and Wealth and Asset Management segment ($621 million).
Dividend Yield: 3.3%
Fifth Third Bancorp offers a reliable dividend with a 3.26% yield, though it's below the top 25% of U.S. dividend payers. The bank's dividends have been stable and growing over the past decade, supported by a sustainable payout ratio of 45.7%. Recent events include preferred stock buybacks and impairment charges from fraud-related losses, impacting net income by US$3.5 million in Q3 2025 but not affecting its ability to cover dividends effectively.
- Click to explore a detailed breakdown of our findings in Fifth Third Bancorp's dividend report.
- Our valuation report here indicates Fifth Third Bancorp may be undervalued.
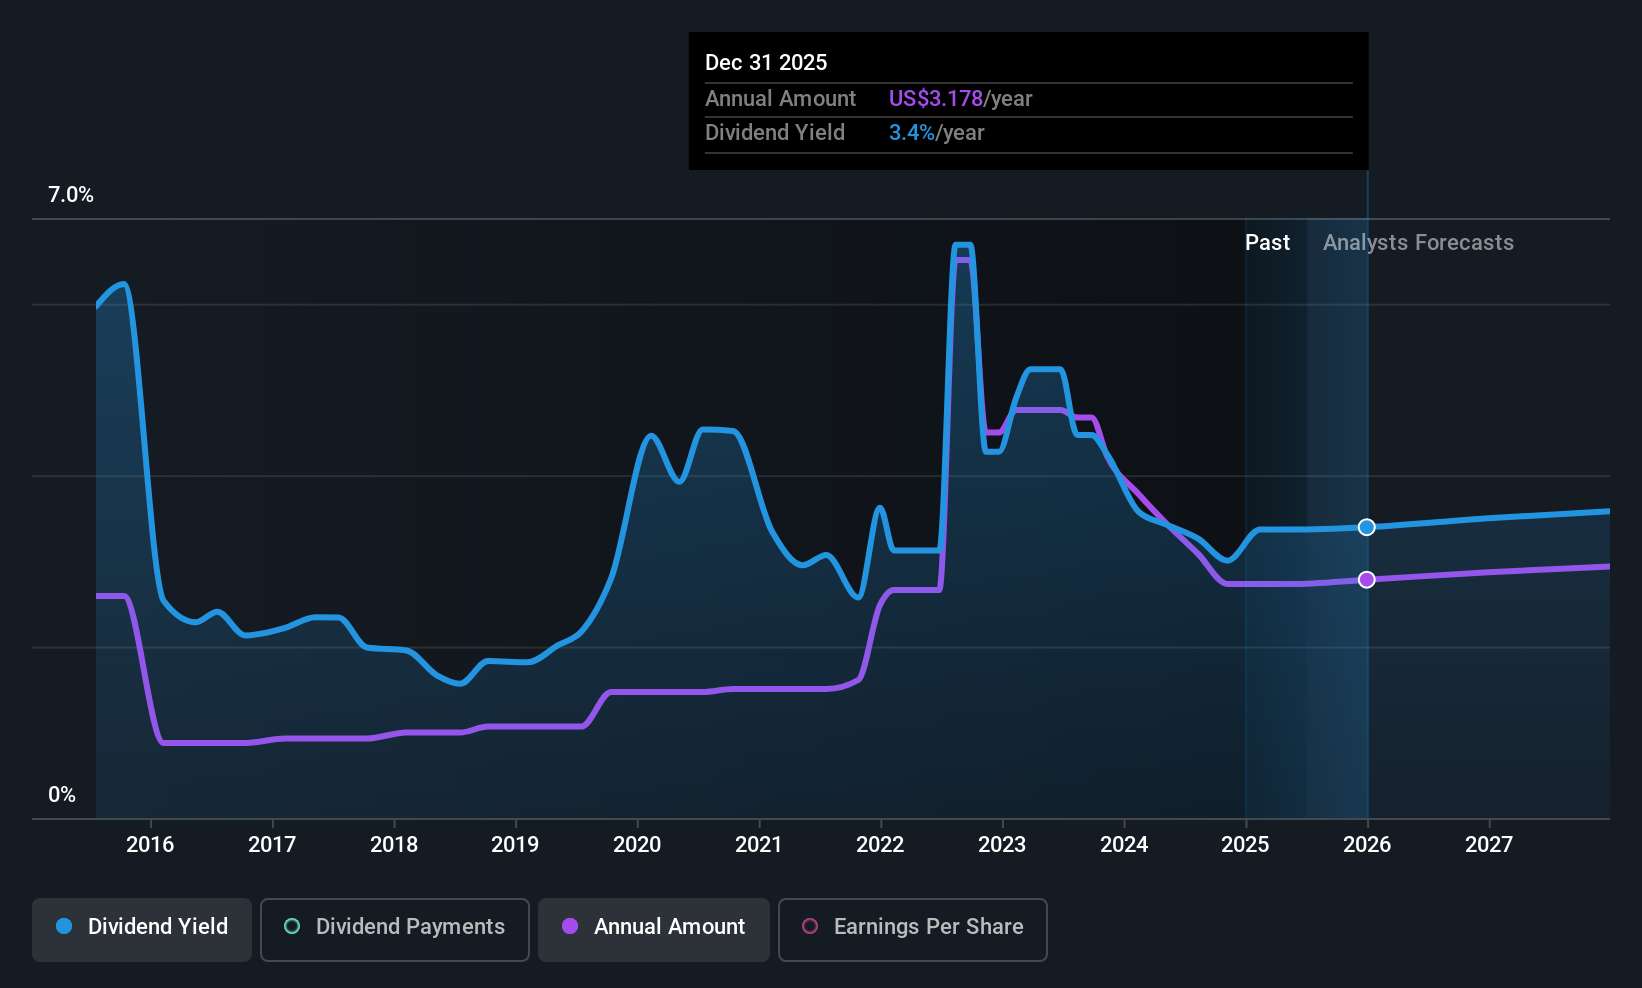
ConocoPhillips (COP)
Simply Wall St Dividend Rating: ★★★★☆☆
Overview: ConocoPhillips is engaged in the exploration, production, transportation, and marketing of crude oil, bitumen, natural gas, LNG, and natural gas liquids with a market capitalization of approximately $123 billion.
Operations: ConocoPhillips generates revenue from several key segments, including $6.02 billion from Alaska, $5.59 billion from Canada, $40.19 billion from the Lower 48 states, $2.66 billion from Asia Pacific, and $6.97 billion from Europe, Middle East and North Africa.
Dividend Yield: 3.3%
ConocoPhillips maintains a steady dividend with a $0.78 per share payout, supported by a 41.7% earnings payout ratio and 56.3% cash flow coverage, despite past volatility in its dividend history. The company's recent Q2 earnings showed US$1.97 billion net income on US$14 billion sales, while production guidance remains robust at over 2 million barrels of oil equivalent per day for the year, reinforcing its capacity to sustain dividends amidst strategic asset sales and buybacks totaling US$37 billion since 2016.
- Click here to discover the nuances of ConocoPhillips with our detailed analytical dividend report.
- The analysis detailed in our ConocoPhillips valuation report hints at an deflated share price compared to its estimated value.
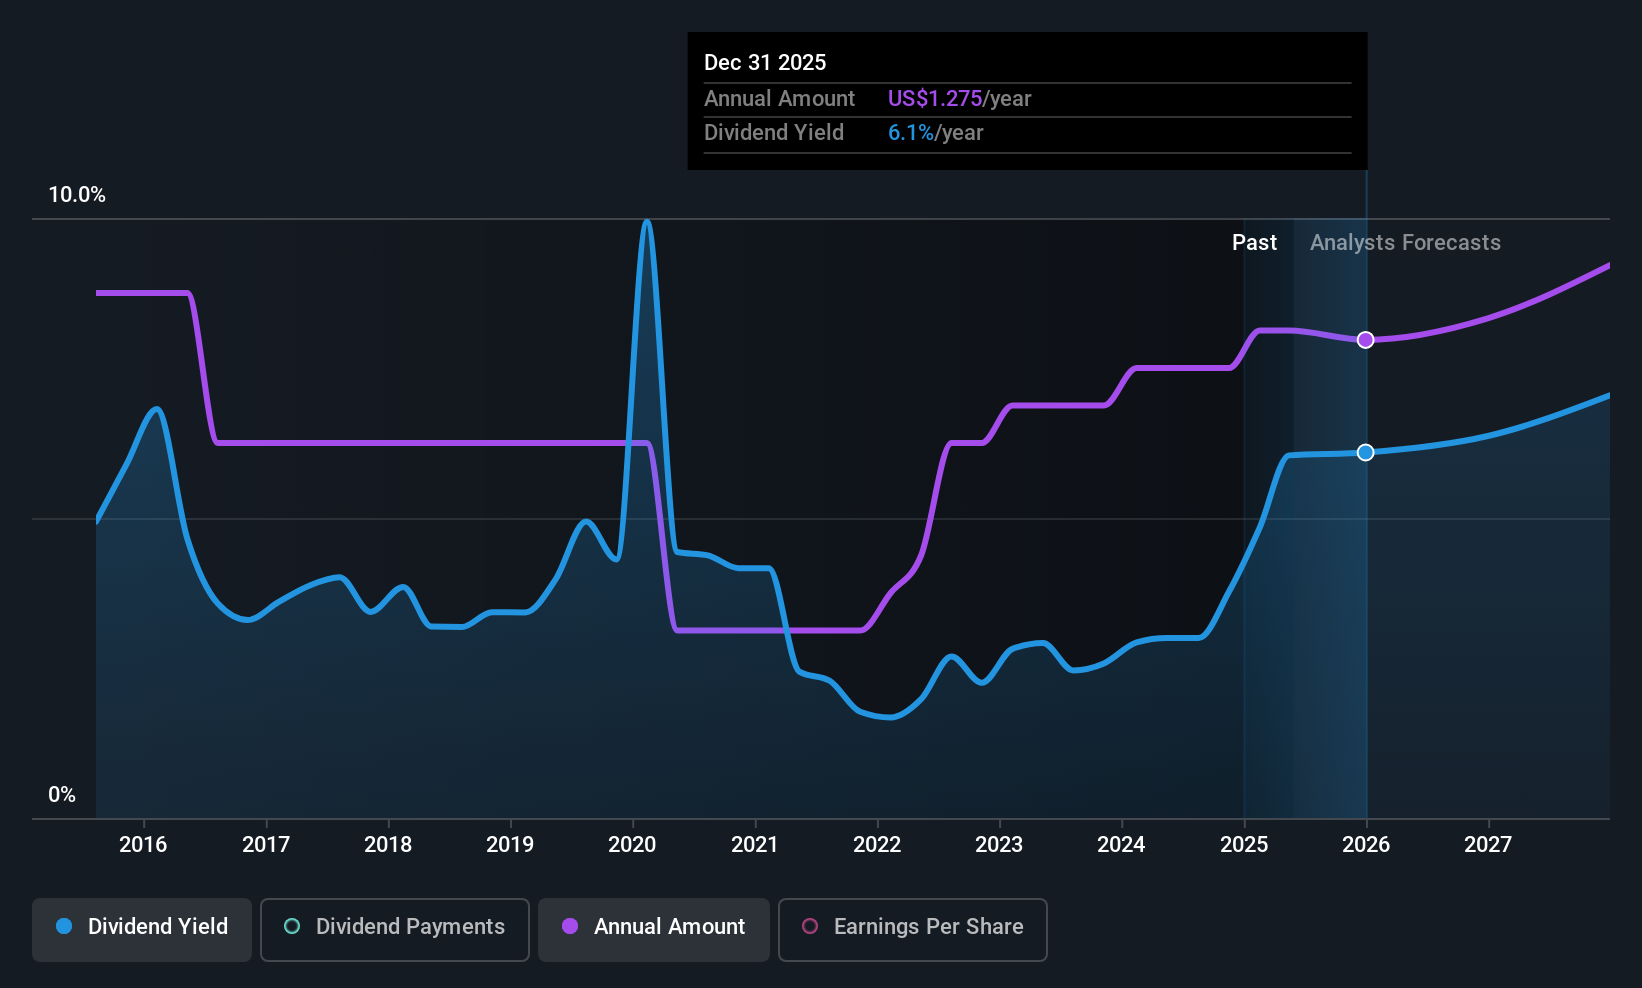
Murphy Oil (MUR)
Simply Wall St Dividend Rating: ★★★★☆☆
Overview: Murphy Oil Corporation is an oil and gas exploration and production company with operations in the United States, Canada, and internationally, boasting a market cap of approximately $4.29 billion.
Operations: Murphy Oil Corporation's revenue segments include $546.20 million from its Canadian exploration and production operations and $2.23 billion from its United States exploration and production activities.
Dividend Yield: 4.5%
Murphy Oil offers a dividend of $1.30 per share annually, with a 63.8% earnings payout ratio and 41.2% cash flow coverage, indicating sustainability despite past volatility in payments. Recent Q2 results showed declining revenue at $695.57 million and net income at $22.28 million compared to the previous year, reflecting challenges that may affect future payouts. Production guidance for 2025 suggests stability, with expected net production between 174,500 to 182,500 BOEPD for the year.
- Unlock comprehensive insights into our analysis of Murphy Oil stock in this dividend report.
- Our valuation report unveils the possibility Murphy Oil's shares may be trading at a premium.
Where To Now?
- Click this link to deep-dive into the 126 companies within our Top US Dividend Stocks screener.
- Have you diversified into these companies? Leverage the power of Simply Wall St's portfolio to keep a close eye on market movements affecting your investments.
- Unlock the power of informed investing with Simply Wall St, your free guide to navigating stock markets worldwide.
Searching for a Fresh Perspective?
- Explore high-performing small cap companies that haven't yet garnered significant analyst attention.
- Fuel your portfolio with companies showing strong growth potential, backed by optimistic outlooks both from analysts and management.
- Find companies with promising cash flow potential yet trading below their fair value.
This article by Simply Wall St is general in nature. We provide commentary based on historical data and analyst forecasts only using an unbiased methodology and our articles are not intended to be financial advice. It does not constitute a recommendation to buy or sell any stock, and does not take account of your objectives, or your financial situation. We aim to bring you long-term focused analysis driven by fundamental data. Note that our analysis may not factor in the latest price-sensitive company announcements or qualitative material. Simply Wall St has no position in any stocks mentioned.
New: AI Stock Screener & Alerts
Our new AI Stock Screener scans the market every day to uncover opportunities.
• Dividend Powerhouses (3%+ Yield)
• Undervalued Small Caps with Insider Buying
• High growth Tech and AI Companies
Or build your own from over 50 metrics.
Have feedback on this article? Concerned about the content? Get in touch with us directly. Alternatively, email editorial-team@simplywallst.com
About NasdaqGS:FITB
Fifth Third Bancorp
Operates as the bank holding company for Fifth Third Bank, National Association that provides a range of financial products and services in the United States.
Flawless balance sheet established dividend payer.
Similar Companies
Market Insights


Advertisement
Weekly Picks
ST


stuart_roberts on Unicycive Therapeutics ·
Looking to be second time lucky with a game-changing new product
Fair Value:US$21.5361.6% undervalued
147 followersusers have followed this narrative
0 commentsusers have commented on this narrative
19 likesusers have liked this narrative
DE


Degen_GCR on Everpure ·
Second order memory play likely to double in a year
Fair Value:US$18054.9% undervalued
27 followersusers have followed this narrative
1 commentusers have commented on this narrative
18 likesusers have liked this narrative
DO


Double_Bubbler on Intuitive Machines ·
Intuitive Machines: To The Moon and Beyond!
Fair Value:US$42.319.9% undervalued
15 followersusers have followed this narrative
0 commentsusers have commented on this narrative
6 likesusers have liked this narrative
YI

yiannisz on AppLovin ·
AppLovin’s AI Engine Is Printing Profit
Fair Value:US$989.2449.4% undervalued
34 followersusers have followed this narrative
2 commentsusers have commented on this narrative
1 likeusers have liked this narrative
Recently Updated Narratives
AN
Anthony_Lee on Gold Li Holdings Berhad ·
Gold Li Pullback Puts Focus On Earnings Growth And Asset Value
Fair Value:RM 0.247.5% undervalued
1 followerusers have followed this narrative
0 commentsusers have commented on this narrative
0 likesusers have liked this narrative
CL


Clive_Thompson on Take-Two Interactive Software ·
Take-Two Interactive: The Calm Before the Storm NASDAQ: TTWO Last Price: $242.41 Date: May 15, 2026
Fair Value:US$276.9712.5% undervalued
6 followersusers have followed this narrative
0 commentsusers have commented on this narrative
0 likesusers have liked this narrative
NI


niteco on Texas Instruments ·
Engineered for Stability. Positioned for Growth.
Fair Value:US$36015.9% undervalued
11 followersusers have followed this narrative
0 commentsusers have commented on this narrative
0 likesusers have liked this narrative
Popular Narratives
GO

GoldenSands on QuantumScape ·
QuantumScape: A Mispriced Deep‑Tech Inflection Point With Multi‑Billion‑Dollar Optionality
Fair Value:US$8590.6% undervalued
112 followersusers have followed this narrative
2 commentsusers have commented on this narrative
31 likesusers have liked this narrative
TR


tripledub on Meta Platforms ·
The $135 Billion Bet That Should Make Every Shareholder Nervous
Fair Value:US$74017.0% undervalued
39 followersusers have followed this narrative
3 commentsusers have commented on this narrative
33 likesusers have liked this narrative
AN


AnalystConsensusTarget on NVIDIA ·
NVDA: Expanding AI Demand Will Drive Major Data Center Investments Through 2026
Fair Value:US$268.6116.1% undervalued
1186 followersusers have followed this narrative
7 commentsusers have commented on this narrative
34 likesusers have liked this narrative

