
The external fund manager backed by Berkshire Hathaway's Charlie Munger, Li Lu, makes no bones about it when he says 'The biggest investment risk is not the volatility of prices, but whether you will suffer a permanent loss of capital.' It's only natural to consider a company's balance sheet when you examine how risky it is, since debt is often involved when a business collapses. We can see that Union Pacific Corporation (NYSE:UNP) does use debt in its business. But the more important question is: how much risk is that debt creating?
When Is Debt A Problem?
Debt and other liabilities become risky for a business when it cannot easily fulfill those obligations, either with free cash flow or by raising capital at an attractive price. In the worst case scenario, a company can go bankrupt if it cannot pay its creditors. However, a more usual (but still expensive) situation is where a company must dilute shareholders at a cheap share price simply to get debt under control. Of course, plenty of companies use debt to fund growth, without any negative consequences. When we think about a company's use of debt, we first look at cash and debt together.
Check out our latest analysis for Union Pacific
What Is Union Pacific's Net Debt?
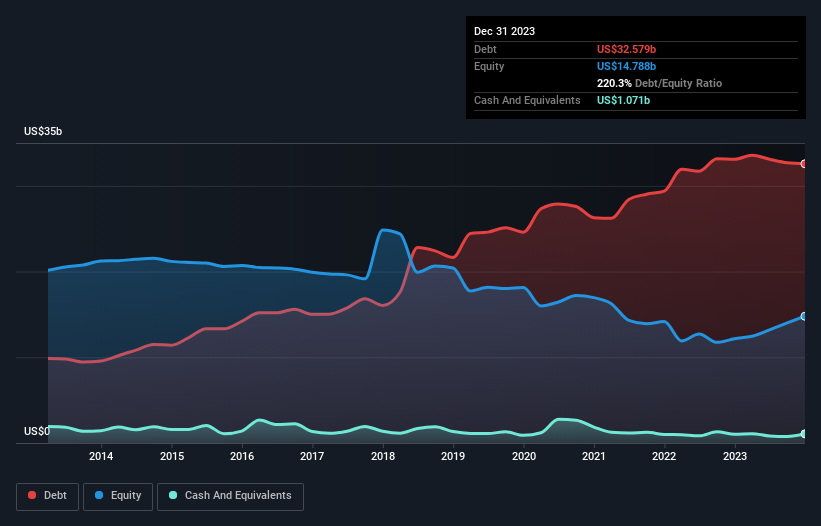
The chart below, which you can click on for greater detail, shows that Union Pacific had US$32.6b in debt in December 2023; about the same as the year before. However, because it has a cash reserve of US$1.07b, its net debt is less, at about US$31.5b.
A Look At Union Pacific's Liabilities
Zooming in on the latest balance sheet data, we can see that Union Pacific had liabilities of US$5.11b due within 12 months and liabilities of US$47.2b due beyond that. Offsetting this, it had US$1.07b in cash and US$1.93b in receivables that were due within 12 months. So its liabilities total US$49.3b more than the combination of its cash and short-term receivables.
This deficit isn't so bad because Union Pacific is worth a massive US$146.5b, and thus could probably raise enough capital to shore up its balance sheet, if the need arose. However, it is still worthwhile taking a close look at its ability to pay off debt.
We use two main ratios to inform us about debt levels relative to earnings. The first is net debt divided by earnings before interest, tax, depreciation, and amortization (EBITDA), while the second is how many times its earnings before interest and tax (EBIT) covers its interest expense (or its interest cover, for short). The advantage of this approach is that we take into account both the absolute quantum of debt (with net debt to EBITDA) and the actual interest expenses associated with that debt (with its interest cover ratio).
Union Pacific's debt is 2.8 times its EBITDA, and its EBIT cover its interest expense 6.8 times over. This suggests that while the debt levels are significant, we'd stop short of calling them problematic. Unfortunately, Union Pacific saw its EBIT slide 7.6% in the last twelve months. If earnings continue on that decline then managing that debt will be difficult like delivering hot soup on a unicycle. There's no doubt that we learn most about debt from the balance sheet. But ultimately the future profitability of the business will decide if Union Pacific can strengthen its balance sheet over time. So if you want to see what the professionals think, you might find this free report on analyst profit forecasts to be interesting.
Finally, while the tax-man may adore accounting profits, lenders only accept cold hard cash. So we always check how much of that EBIT is translated into free cash flow. During the last three years, Union Pacific produced sturdy free cash flow equating to 59% of its EBIT, about what we'd expect. This free cash flow puts the company in a good position to pay down debt, when appropriate.
Our View
While Union Pacific's EBIT growth rate does give us pause, its conversion of EBIT to free cash flow and interest cover suggest it can stay on top of its debt load. We think that Union Pacific's debt does make it a bit risky, after considering the aforementioned data points together. Not all risk is bad, as it can boost share price returns if it pays off, but this debt risk is worth keeping in mind. There's no doubt that we learn most about debt from the balance sheet. But ultimately, every company can contain risks that exist outside of the balance sheet. For example - Union Pacific has 1 warning sign we think you should be aware of.
At the end of the day, it's often better to focus on companies that are free from net debt. You can access our special list of such companies (all with a track record of profit growth). It's free.
The New Payments ETF Is Live on NASDAQ:
Money is moving to real-time rails, and a newly listed ETF now gives investors direct exposure. Fast settlement. Institutional custody. Simple access.
Explore how this launch could reshape portfolios
Sponsored ContentNew: AI Stock Screener & Alerts
Our new AI Stock Screener scans the market every day to uncover opportunities.
• Dividend Powerhouses (3%+ Yield)
• Undervalued Small Caps with Insider Buying
• High growth Tech and AI Companies
Or build your own from over 50 metrics.
Have feedback on this article? Concerned about the content? Get in touch with us directly. Alternatively, email editorial-team (at) simplywallst.com.
This article by Simply Wall St is general in nature. We provide commentary based on historical data and analyst forecasts only using an unbiased methodology and our articles are not intended to be financial advice. It does not constitute a recommendation to buy or sell any stock, and does not take account of your objectives, or your financial situation. We aim to bring you long-term focused analysis driven by fundamental data. Note that our analysis may not factor in the latest price-sensitive company announcements or qualitative material. Simply Wall St has no position in any stocks mentioned.
About NYSE:UNP
Union Pacific
Through its subsidiary, Union Pacific Railroad Company, operates in the railroad business in the United States.
Solid track record established dividend payer.
Similar Companies
Market Insights

Weekly Picks

THE KINGDOM OF BROWN GOODS: WHY MGPI IS BEING CRUSHED BY INVENTORY & PRIMED FOR RESURRECTION


Why Vertical Aerospace (NYSE: EVTL) is Worth Possibly Over 13x its Current Price


The Quiet Giant That Became AI’s Power Grid
Recently Updated Narratives

Agfa-Gevaert is a digital and materials turnaround opportunity, with growth potential in ZIRFON, but carrying legacy risks.

Hitit Bilgisayar Hizmetleri will achieve a 19.7% revenue boost in the next five years


MINISO's fair value is projected at 26.69 with an anticipated PE ratio shift of 20x
Popular Narratives


MicroVision will explode future revenue by 380.37% with a vision towards success


Crazy Undervalued 42 Baggers Silver Play (Active & Running Mine)


