- United States
- /
- General Merchandise and Department Stores
- /
- NasdaqGM:OLLI
Estimating The Fair Value Of Ollie's Bargain Outlet Holdings, Inc. (NASDAQ:OLLI)


Key Insights
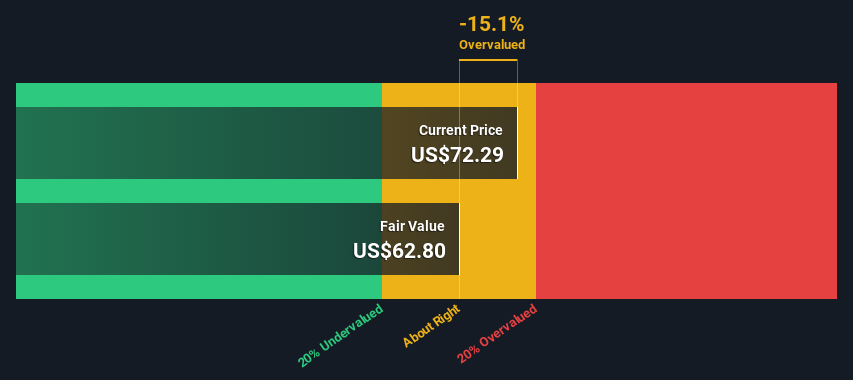
- The projected fair value for Ollie's Bargain Outlet Holdings is US$62.80 based on 2 Stage Free Cash Flow to Equity
- Current share price of US$72.29 suggests Ollie's Bargain Outlet Holdings is potentially trading close to its fair value
- Analyst price target for OLLI is US$86.42, which is 38% above our fair value estimate
In this article we are going to estimate the intrinsic value of Ollie's Bargain Outlet Holdings, Inc. (NASDAQ:OLLI) by estimating the company's future cash flows and discounting them to their present value. We will take advantage of the Discounted Cash Flow (DCF) model for this purpose. Before you think you won't be able to understand it, just read on! It's actually much less complex than you'd imagine.
We generally believe that a company's value is the present value of all of the cash it will generate in the future. However, a DCF is just one valuation metric among many, and it is not without flaws. If you still have some burning questions about this type of valuation, take a look at the Simply Wall St analysis model.
View our latest analysis for Ollie's Bargain Outlet Holdings
The Method
We're using the 2-stage growth model, which simply means we take in account two stages of company's growth. In the initial period the company may have a higher growth rate and the second stage is usually assumed to have a stable growth rate. To start off with, we need to estimate the next ten years of cash flows. Where possible we use analyst estimates, but when these aren't available we extrapolate the previous free cash flow (FCF) from the last estimate or reported value. We assume companies with shrinking free cash flow will slow their rate of shrinkage, and that companies with growing free cash flow will see their growth rate slow, over this period. We do this to reflect that growth tends to slow more in the early years than it does in later years.
Generally we assume that a dollar today is more valuable than a dollar in the future, so we discount the value of these future cash flows to their estimated value in today's dollars:
10-year free cash flow (FCF) estimate
| 2024 | 2025 | 2026 | 2027 | 2028 | 2029 | 2030 | 2031 | 2032 | 2033 | |
| Levered FCF ($, Millions) | US$32.0m | US$122.7m | US$157.9m | US$200.0m | US$210.5m | US$219.7m | US$227.9m | US$235.5m | US$242.6m | US$249.3m |
| Growth Rate Estimate Source | Analyst x1 | Analyst x4 | Analyst x4 | Analyst x2 | Est @ 5.26% | Est @ 4.37% | Est @ 3.74% | Est @ 3.31% | Est @ 3.00% | Est @ 2.79% |
| Present Value ($, Millions) Discounted @ 7.2% | US$29.9 | US$107 | US$128 | US$152 | US$149 | US$145 | US$140 | US$135 | US$130 | US$125 |
("Est" = FCF growth rate estimated by Simply Wall St)
Present Value of 10-year Cash Flow (PVCF) = US$1.2b
The second stage is also known as Terminal Value, this is the business's cash flow after the first stage. The Gordon Growth formula is used to calculate Terminal Value at a future annual growth rate equal to the 5-year average of the 10-year government bond yield of 2.3%. We discount the terminal cash flows to today's value at a cost of equity of 7.2%.
Terminal Value (TV)= FCF2033 × (1 + g) ÷ (r – g) = US$249m× (1 + 2.3%) ÷ (7.2%– 2.3%) = US$5.2b
Present Value of Terminal Value (PVTV)= TV / (1 + r)10= US$5.2b÷ ( 1 + 7.2%)10= US$2.6b
The total value is the sum of cash flows for the next ten years plus the discounted terminal value, which results in the Total Equity Value, which in this case is US$3.9b. To get the intrinsic value per share, we divide this by the total number of shares outstanding. Compared to the current share price of US$72.3, the company appears around fair value at the time of writing. Valuations are imprecise instruments though, rather like a telescope - move a few degrees and end up in a different galaxy. Do keep this in mind.
Important Assumptions
Now the most important inputs to a discounted cash flow are the discount rate, and of course, the actual cash flows. Part of investing is coming up with your own evaluation of a company's future performance, so try the calculation yourself and check your own assumptions. The DCF also does not consider the possible cyclicality of an industry, or a company's future capital requirements, so it does not give a full picture of a company's potential performance. Given that we are looking at Ollie's Bargain Outlet Holdings as potential shareholders, the cost of equity is used as the discount rate, rather than the cost of capital (or weighted average cost of capital, WACC) which accounts for debt. In this calculation we've used 7.2%, which is based on a levered beta of 1.061. Beta is a measure of a stock's volatility, compared to the market as a whole. We get our beta from the industry average beta of globally comparable companies, with an imposed limit between 0.8 and 2.0, which is a reasonable range for a stable business.
SWOT Analysis for Ollie's Bargain Outlet Holdings
- Earnings growth over the past year exceeded its 5-year average.
- Currently debt free.
- Earnings growth over the past year underperformed the Multiline Retail industry.
- Expensive based on P/E ratio and estimated fair value.
- Annual revenue is forecast to grow faster than the American market.
- Annual earnings are forecast to decline for the next 3 years.
Looking Ahead:
Whilst important, the DCF calculation ideally won't be the sole piece of analysis you scrutinize for a company. The DCF model is not a perfect stock valuation tool. Instead the best use for a DCF model is to test certain assumptions and theories to see if they would lead to the company being undervalued or overvalued. If a company grows at a different rate, or if its cost of equity or risk free rate changes sharply, the output can look very different. For Ollie's Bargain Outlet Holdings, we've put together three relevant factors you should explore:
- Risks: We feel that you should assess the 1 warning sign for Ollie's Bargain Outlet Holdings we've flagged before making an investment in the company.
- Management:Have insiders been ramping up their shares to take advantage of the market's sentiment for OLLI's future outlook? Check out our management and board analysis with insights on CEO compensation and governance factors.
- Other High Quality Alternatives: Do you like a good all-rounder? Explore our interactive list of high quality stocks to get an idea of what else is out there you may be missing!
PS. Simply Wall St updates its DCF calculation for every American stock every day, so if you want to find the intrinsic value of any other stock just search here.
New: AI Stock Screener & Alerts
Our new AI Stock Screener scans the market every day to uncover opportunities.
• Dividend Powerhouses (3%+ Yield)
• Undervalued Small Caps with Insider Buying
• High growth Tech and AI Companies
Or build your own from over 50 metrics.
Have feedback on this article? Concerned about the content? Get in touch with us directly. Alternatively, email editorial-team (at) simplywallst.com.
This article by Simply Wall St is general in nature. We provide commentary based on historical data and analyst forecasts only using an unbiased methodology and our articles are not intended to be financial advice. It does not constitute a recommendation to buy or sell any stock, and does not take account of your objectives, or your financial situation. We aim to bring you long-term focused analysis driven by fundamental data. Note that our analysis may not factor in the latest price-sensitive company announcements or qualitative material. Simply Wall St has no position in any stocks mentioned.
About NasdaqGM:OLLI
Ollie's Bargain Outlet Holdings
Operates as a retailer of brand name merchandise in the United States.
Flawless balance sheet with acceptable track record.
Similar Companies
Market Insights

Community Narratives

