Advertisement
- United States
- /
- Professional Services
- /
- NYSE:TRU
Should You Rethink Your Position on TransUnion After Recent 15% Share Price Drop?

Simply Wall St
Reviewed by Bailey Pemberton
If you’re standing at a crossroads wondering whether to buy, hold, or sell TransUnion, you’re not alone. After all, the company is a well-known player in the global information services sector, but its stock performance has been a real talking point lately. With a closing price of $79.25, investors have watched the stock shift gears. There was a dip of 3.7% in the past week and a steeper fall of 15.1% over the last month. Year-to-date, the slide stands at 13.7%, and the one-year return is a notable -25.3%. It’s enough to give anyone pause. However, looking at a broader timeframe, the three-year return at 42.4% suggests that the story is more complex than recent negatives alone might indicate.
What’s driving this volatility? Market sentiment around consumer data privacy and evolving industry standards has caused some investors to reprice risk and opportunity in the space. While there haven’t been major shifts from headline news affecting TransUnion directly, the changing tide in tech and data companies has clearly made an impact.
Now comes the big question: is TransUnion undervalued, or is the market getting it right? According to our standard checklist, which considers six key valuation metrics, the company rates a value score of 3. That means TransUnion is considered undervalued in three out of six ways. This result is notable, but there’s more to the story than just numbers on a scorecard. Below, we break down these valuation methods and examine what may be most meaningful for investors. Stay tuned as we introduce a smarter way to assess this stock at the end.
Why TransUnion is lagging behind its peers
Approach 1: TransUnion Discounted Cash Flow (DCF) Analysis
The Discounted Cash Flow (DCF) model estimates a business’s intrinsic value by projecting its future cash flows and then discounting those flows back to today’s dollars. For TransUnion, this means we look ahead at how much cash the company is expected to generate, and then work out what all those future dollars are really worth to investors right now.
TransUnion’s latest reported free cash flow stands at $485 million. Analysts forecast this figure to grow in the coming years, with projections reaching $1,157 million by 2029. Only the first five years are backed by detailed analyst estimates; the remaining years, extending out to 2035, use industry-standard extrapolations to account for long-term trends. The DCF model applied here is a 2 Stage Free Cash Flow to Equity framework, providing a holistic picture of potential value over time.
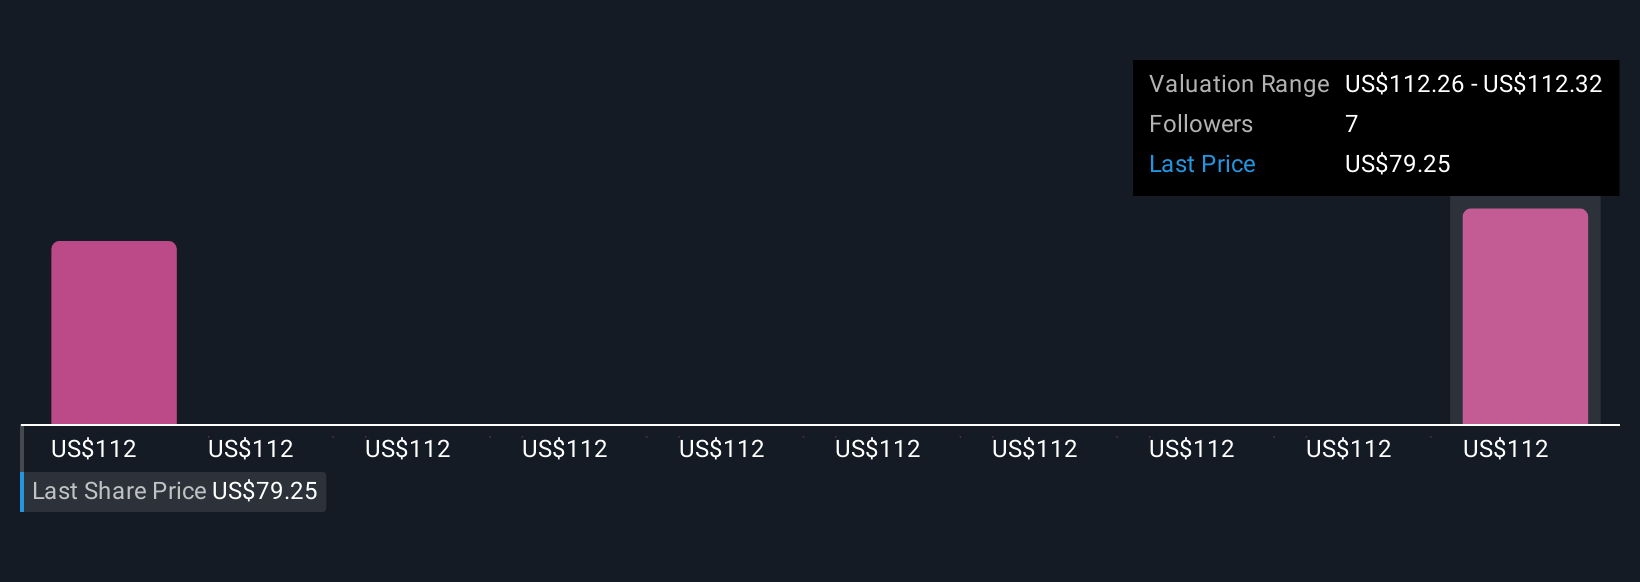
According to these projections, TransUnion’s intrinsic value is estimated at $112.32 per share. With the stock currently trading at $79.25, this model suggests a 29.4% discount to fair value. In simple terms, the market price appears to significantly undervalue the company’s potential future cash generation power.
Result: UNDERVALUED
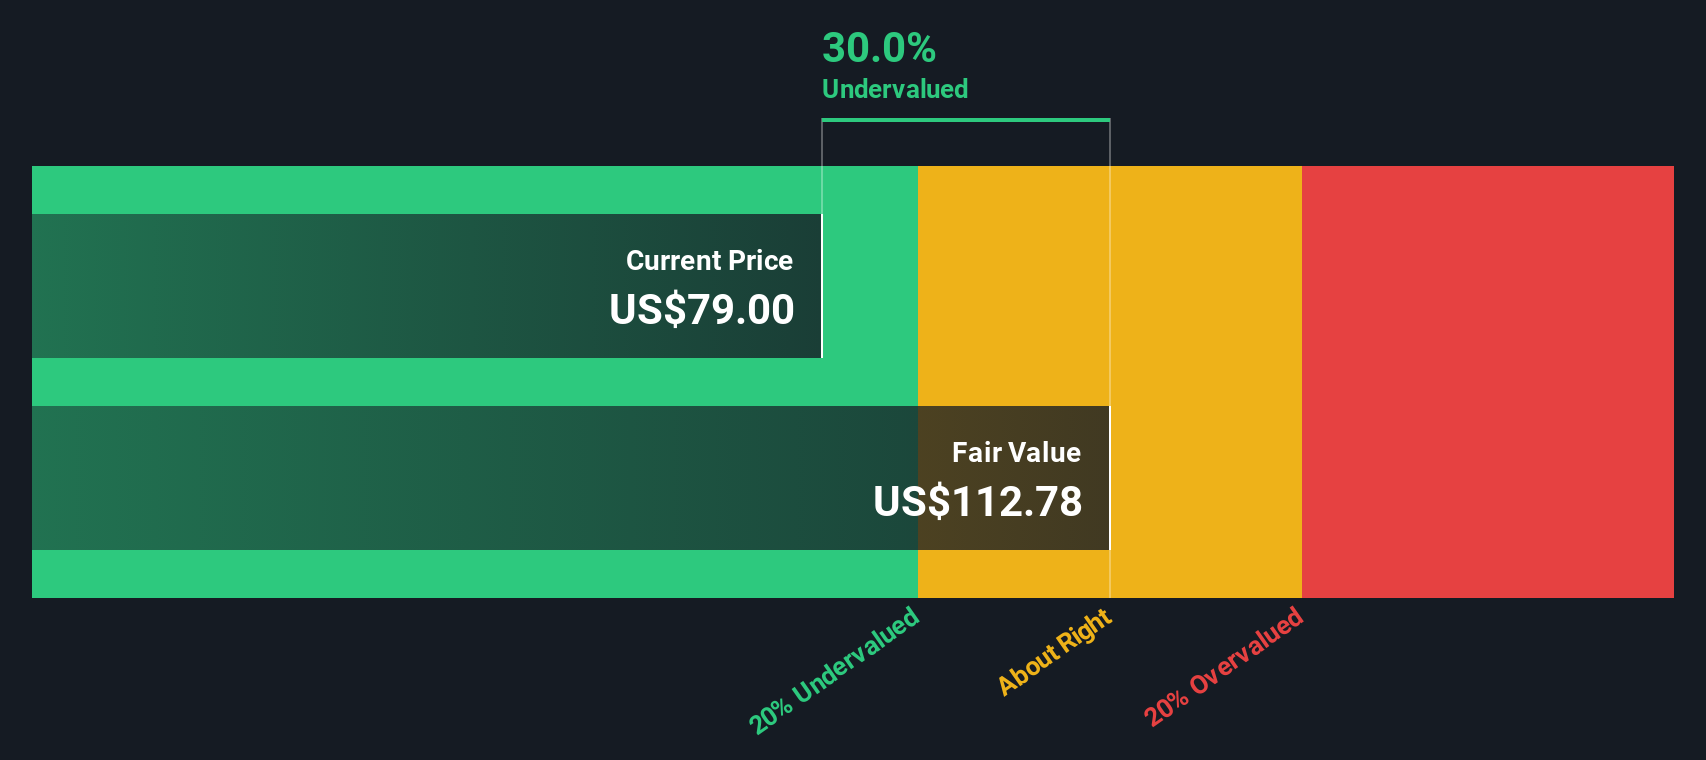
Our Discounted Cash Flow (DCF) analysis suggests TransUnion is undervalued by 29.4%. Track this in your watchlist or portfolio, or discover more undervalued stocks.
Approach 2: TransUnion Price vs Earnings
The price-to-earnings (PE) ratio is a well-established way to value profitable companies like TransUnion. This metric is popular because it reflects what the market is willing to pay today for a dollar of current earnings. It is particularly useful when a business has consistent earnings power.
Growth expectations and company-specific risks play a big role in determining what a "normal" or "fair" PE ratio should be. Typically, faster-growing or lower-risk companies warrant higher PE multiples, while businesses facing slower growth or more risk trade on lower ones.
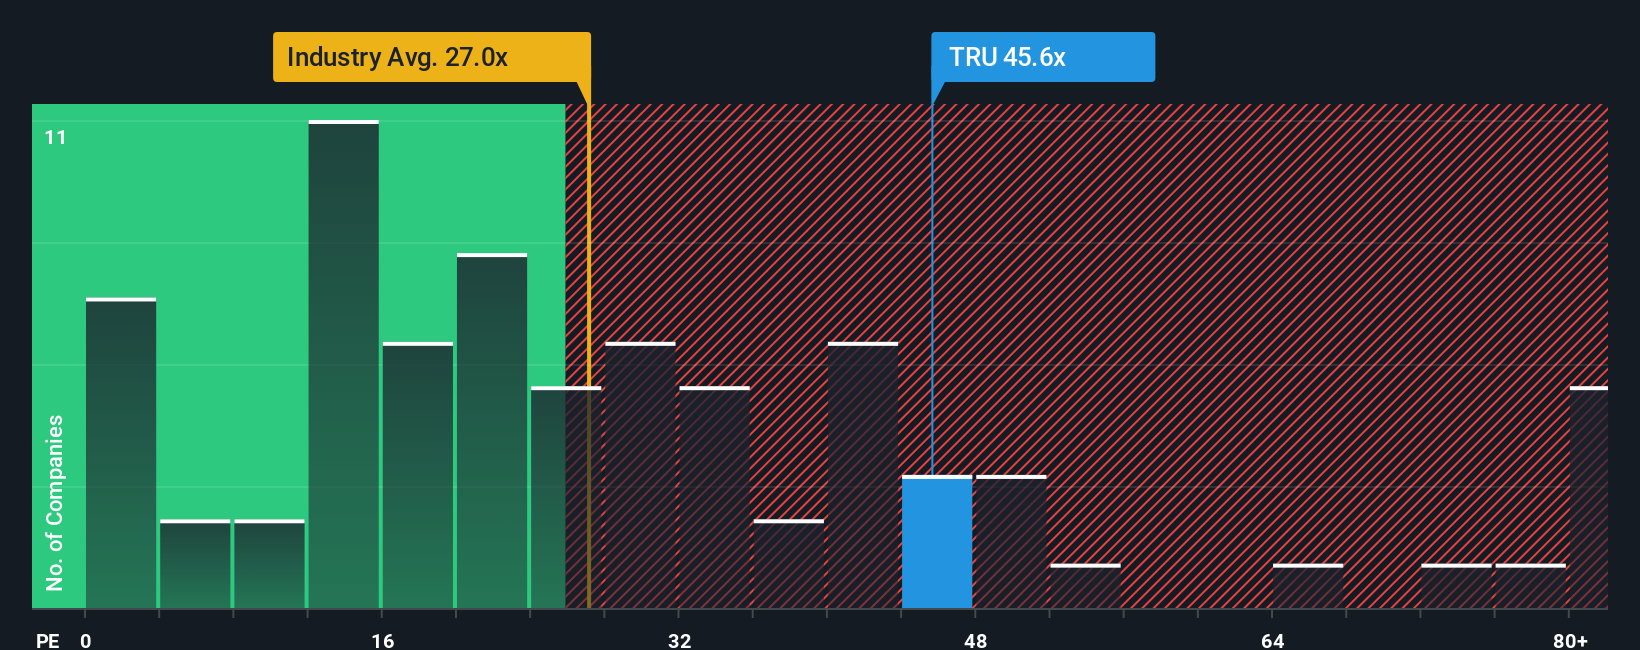
TransUnion currently trades at a PE ratio of 39.4x. For context, the average PE in the Professional Services industry is 26.5x, while similar peers average 24.9x. On the surface, TransUnion appears more expensive than both its direct competitors and the sector as a whole.
This is where Simply Wall St's Fair Ratio comes in. The Fair Ratio, which stands at 33.8x for TransUnion, is calculated using a broader set of variables beyond mere industry averages. It blends factors such as earnings growth prospects, risk profile, profit margins, size, and other unique business attributes, offering a more tailored and dynamic valuation benchmark.
Because the Fair Ratio is designed to be comprehensive, it often offers a truer sense of a stock's worth than a simple comparison to sector or peer averages. For TransUnion, its current PE of 39.4x is above the Fair Ratio of 33.8x. This indicates that the stock is trading at a premium to what would be considered fair value given its fundamentals and outlook.
Result: OVERVALUED
PE ratios tell one story, but what if the real opportunity lies elsewhere? Discover companies where insiders are betting big on explosive growth.
Upgrade Your Decision Making: Choose your TransUnion Narrative
Earlier we mentioned that there is an even better way to understand valuation, so let's introduce you to Narratives. Narratives make investing more approachable by letting you express your own story or perspective about a company. They allow investors to connect the company's real-world opportunities and challenges to specific, transparent financial forecasts such as growth rates, profit margins, and a fair value estimate. This turns raw numbers into an actionable investment thesis.
With Narratives, you can see how your rationale links directly to what you believe TransUnion is worth, and easily adjust your view as the facts change. This tool is simple to use and is already available on Simply Wall St's Community page, where millions of investors share and compare their thinking.
When deciding to buy or sell, Narratives help you compare your own Fair Value to the current market price, sharpening your conviction or highlighting a disconnect that merits a closer look. Best of all, Narratives update automatically when new earnings or news drops, so your investment logic stays current without any extra effort.
For example, some investors believe TransUnion’s digital transformation and global expansion could push its fair value as high as $135 per share, while others worry about regulatory risks and have a more conservative estimate closer to $84. This shows how Narratives make room for all perspectives, not just the consensus.
Do you think there's more to the story for TransUnion? Create your own Narrative to let the Community know!
This article by Simply Wall St is general in nature. We provide commentary based on historical data and analyst forecasts only using an unbiased methodology and our articles are not intended to be financial advice. It does not constitute a recommendation to buy or sell any stock, and does not take account of your objectives, or your financial situation. We aim to bring you long-term focused analysis driven by fundamental data. Note that our analysis may not factor in the latest price-sensitive company announcements or qualitative material. Simply Wall St has no position in any stocks mentioned.
Valuation is complex, but we're here to simplify it.
Discover if TransUnion might be undervalued or overvalued with our detailed analysis, featuring fair value estimates, potential risks, dividends, insider trades, and its financial condition.
Access Free AnalysisHave feedback on this article? Concerned about the content? Get in touch with us directly. Alternatively, email editorial-team@simplywallst.com
About NYSE:TRU
TransUnion
Operates as a global consumer credit reporting agency that provides risk and information solutions.
Fair value with moderate growth potential.
Similar Companies
Market Insights

Advertisement
Community Narratives
A formidable player in AI and enterprise computing.
Fair Value US$210.00|12.2% overvalued
CO
Community Contributor
IREN's Bold Moves in Sustainable Bitcoin Mining & AI Data Centers
Fair Value US$72.52|17.1% undervalued
BL
Community Contributor
Cooling the Champions: The Aussie Tech Behind F1's Victories
Fair Value AU$12.40|38.1% undervalued
TR
Community Contributor