
Advertisement
- United States
- /
- Professional Services
- /
- NYSE:TRU
Here's Why TransUnion (NYSE:TRU) Has A Meaningful Debt Burden

Legendary fund manager Li Lu (who Charlie Munger backed) once said, 'The biggest investment risk is not the volatility of prices, but whether you will suffer a permanent loss of capital.' So it seems the smart money knows that debt - which is usually involved in bankruptcies - is a very important factor, when you assess how risky a company is. We note that TransUnion (NYSE:TRU) does have debt on its balance sheet. But should shareholders be worried about its use of debt?
What Risk Does Debt Bring?
Debt and other liabilities become risky for a business when it cannot easily fulfill those obligations, either with free cash flow or by raising capital at an attractive price. Part and parcel of capitalism is the process of 'creative destruction' where failed businesses are mercilessly liquidated by their bankers. While that is not too common, we often do see indebted companies permanently diluting shareholders because lenders force them to raise capital at a distressed price. Of course, the upside of debt is that it often represents cheap capital, especially when it replaces dilution in a company with the ability to reinvest at high rates of return. The first thing to do when considering how much debt a business uses is to look at its cash and debt together.
See our latest analysis for TransUnion
How Much Debt Does TransUnion Carry?
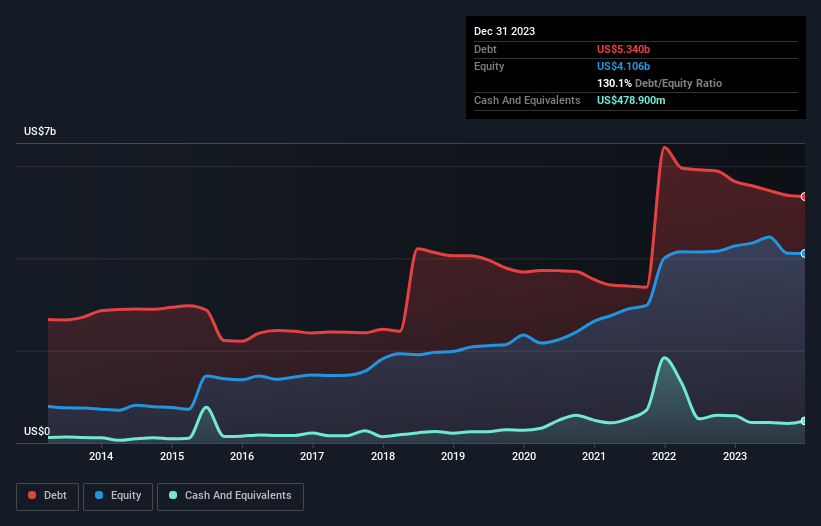
The image below, which you can click on for greater detail, shows that TransUnion had debt of US$5.34b at the end of December 2023, a reduction from US$5.67b over a year. However, it does have US$478.9m in cash offsetting this, leading to net debt of about US$4.86b.
A Look At TransUnion's Liabilities
The latest balance sheet data shows that TransUnion had liabilities of US$1.00b due within a year, and liabilities of US$6.00b falling due after that. Offsetting these obligations, it had cash of US$478.9m as well as receivables valued at US$723.0m due within 12 months. So it has liabilities totalling US$5.80b more than its cash and near-term receivables, combined.
TransUnion has a very large market capitalization of US$15.5b, so it could very likely raise cash to ameliorate its balance sheet, if the need arose. But it's clear that we should definitely closely examine whether it can manage its debt without dilution.
We measure a company's debt load relative to its earnings power by looking at its net debt divided by its earnings before interest, tax, depreciation, and amortization (EBITDA) and by calculating how easily its earnings before interest and tax (EBIT) cover its interest expense (interest cover). The advantage of this approach is that we take into account both the absolute quantum of debt (with net debt to EBITDA) and the actual interest expenses associated with that debt (with its interest cover ratio).
While we wouldn't worry about TransUnion's net debt to EBITDA ratio of 4.3, we think its super-low interest cover of 2.3 times is a sign of high leverage. It seems clear that the cost of borrowing money is negatively impacting returns for shareholders, of late. Even more troubling is the fact that TransUnion actually let its EBIT decrease by 5.6% over the last year. If that earnings trend continues the company will face an uphill battle to pay off its debt. When analysing debt levels, the balance sheet is the obvious place to start. But it is future earnings, more than anything, that will determine TransUnion's ability to maintain a healthy balance sheet going forward. So if you're focused on the future you can check out this free report showing analyst profit forecasts.
But our final consideration is also important, because a company cannot pay debt with paper profits; it needs cold hard cash. So the logical step is to look at the proportion of that EBIT that is matched by actual free cash flow. Looking at the most recent three years, TransUnion recorded free cash flow of 48% of its EBIT, which is weaker than we'd expect. That's not great, when it comes to paying down debt.
Our View
While TransUnion's net debt to EBITDA makes us cautious about it, its track record of covering its interest expense with its EBIT is no better. At least its conversion of EBIT to free cash flow gives us reason to be optimistic. Taking the abovementioned factors together we do think TransUnion's debt poses some risks to the business. So while that leverage does boost returns on equity, we wouldn't really want to see it increase from here. The balance sheet is clearly the area to focus on when you are analysing debt. However, not all investment risk resides within the balance sheet - far from it. For example, we've discovered 1 warning sign for TransUnion that you should be aware of before investing here.
When all is said and done, sometimes its easier to focus on companies that don't even need debt. Readers can access a list of growth stocks with zero net debt 100% free, right now.
Valuation is complex, but we're here to simplify it.
Discover if TransUnion might be undervalued or overvalued with our detailed analysis, featuring fair value estimates, potential risks, dividends, insider trades, and its financial condition.
Access Free AnalysisHave feedback on this article? Concerned about the content? Get in touch with us directly. Alternatively, email editorial-team (at) simplywallst.com.
This article by Simply Wall St is general in nature. We provide commentary based on historical data and analyst forecasts only using an unbiased methodology and our articles are not intended to be financial advice. It does not constitute a recommendation to buy or sell any stock, and does not take account of your objectives, or your financial situation. We aim to bring you long-term focused analysis driven by fundamental data. Note that our analysis may not factor in the latest price-sensitive company announcements or qualitative material. Simply Wall St has no position in any stocks mentioned.
About NYSE:TRU
TransUnion
Operates as a global consumer credit reporting agency that provides risk and information solutions.
Reasonable growth potential with mediocre balance sheet.
Similar Companies
Market Insights

Advertisement
Community Narratives
The Most Undervalued of the Magnificent 7
Fair Value US$237.43|36.3% undervalued
IN
Community Contributor
PVA TePla's New Strategy Aims for 22% Revenue Growth in Semiconductor Recovery
Fair Value €19.19|20.8% undervalued
MI
Community Contributor