
Quote of the Week: “Volatility is often a symptom of risk, but is not a risk in and of itself. Volatility obscures the future, but does not necessarily determine the future.” - Peter Bernstein
Markets are currently dealing with the upheaval of tariffs. But, beyond the uncertainty and potential cost of those tariffs, markets are facing a few very big macro issues:
- 💵 The USD is under pressure - does that continue or does it reverse?
- 💰 Will policymakers finally be forced to deal with unsustainable government debt?
- 🤖 Will AI and automation fulfil their potential to drive global growth?
From 2009 to 2020, investors didn’t have to worry too much about inflation, stagflation and other macro issues. It’s looking increasingly like all those factors might be around more often going forward.
In recent weeks, we’ve covered some ways investors can protect their portfolios in periods of uncertainty, including sector rotation , diversification , and gold .
The All-Weather portfolio strategy is another approach to asset allocation amidst an uncertain future.
This week, we are taking a look at what it is, its strengths and weaknesses, and how individual investors can apply the concept to their own portfolios.
🎧 Would you prefer to listen to these insights? You can find the audio version on our Spotify, Apple Podcasts or YouTube!
What Happened in Markets this Week?
Here’s a quick summary of what’s been going on:
🥶 Bond market shows signs of life after tariff shock ( Axios )
- Junk bond markets froze after April 2's tariff shock, but they are now slowly thawing. Spreads spiked (a sign of investor nervousness), but now they're easing.
- An important index of high-yield spreads hit 4.61% last week but has since narrowed to 4.14%, suggesting panic is cooling. That spread is the difference between “risk-free” bonds and junk bonds, which are “riskier”. When it widens, it means investors demand more yield for holding riskier debt.
- The junk bond market's mini-panic seems contained, at least for now. A narrowing in the spread again suggests risk appetite is slowly returning, but wide bid/offer spreads warn that liquidity is still thin. PE firms and leveraged deals will remain squeezed, but outright credit panic looks off the table.
- If you're eyeing junk bonds, it might be time to start a watchlist. Some analysts suggest letting spreads tighten (more confidence returning) or yields spike again before jumping in, but each to their own.
📄 Figma ignores the fear, files paperwork for an IPO ( TechCrunch )
- Figma has confidentially filed for an IPO, despite a jittery market environment rattled by tariff-driven volatility.
- As we mentioned last week, the likes of Klarna, StubHub, Plaid, Circle, eToro, Chime, and others have all hit pause on their IPO plans, making Figma's move a rare case of bucking the trend.
- Filing now could position Figma to go public quickly if market conditions stabilize. With its $12.5B valuation and a failed $20B Adobe deal behind it, Figma might be aiming to test investor appetite independently, before more IPO windows slam shut.
- Keep Figma on your IPO watchlist. If it prices well, it could signal a reopening of the tech IPO market and offer a compelling play in collaborative software.
👀 Powell says Fed remains in wait-and-see mode; markets processing policy shifts ( Reuters )
- Powell says the Fed’s staying patient on rates but warns tariffs could derail both inflation and jobs.
- Markets heard a hawkish tone (inflation focus over growth/employment), stocks dipped as Powell dismissed the idea of a Fed "put" to rescue markets.
- The Fed’s stuck in a tricky spot: tariffs are nudging inflation up while growth slows. Rate hikes are off the table for now, but cuts aren’t guaranteed either. Traders are now pricing in four cuts by year-end, starting in June, so rate-sensitive assets could rally if that plays out.
- Tariffs may have put rate cuts back on the table. Some investors are repositioning for lower yields with high-quality dividend stocks and more volatility ahead with either cash or defensive sector exposure.
💊 Are importers front-running pharma tariffs? ( Sherwood )
- U.S. pharma imports surged early this year, especially from Ireland, just as the White House began eyeing tariffs on branded drugs.
- Drugmakers may be racing to stockpile before potential duties hit high-margin products.
- If tariffs land, big pharma’s pricing power and profit margins could face pressure. U.S.-listed drugmakers that rely on EU imports might see near-term cost spikes or supply-chain headaches. Meanwhile, generic producers could gain a competitive edge if their supply chains avoid the hit.
- Analysts are reassessing exposure to U.S. pharma giants with heavy import footprints. If tariffs advance, consider trimming positions in branded drugmakers and watching generics for relative outperformance.
🚢 Cancellations of Chinese freight ships begin as bookings plummet ( CNBC )
- The fallout of the U.S.-China trade war is triggering a wave of canceled freight ship sailings as import demand plunges.
- Major U.S. import categories like apparel, furniture, and toys are getting hit hard, and ocean carriers are slashing routes to cope.
- A double-digit drop in inbound containers could ripple through the transport, retail, and logistics sectors. Watch for further pressure on port operators, rail, and trucking stocks (e.g., JB Hunt ). Meanwhile, Vietnam is emerging as a freight winner, and logistics and infrastructure names tied to Southeast Asia could benefit.
- Investors are rebalancing their logistics exposure. Some are lightening up on U.S. freight and port names vulnerable to China volume drops, and looking to Vietnam-aligned supply chain plays for upside.
✂️ Temu slashes U.S. ad spending after Trump China tariffs ( CNBC )
- Temu has slashed U.S. ad spend and plummeted off App Store charts after Trump’s new tariffs made its China-to-U.S. shipping model drastically more expensive.
- The 145% tariff rate and upcoming end of the “de minimis rule” (where shipments under $800 can enter the country duty-free) are forcing price hikes, ad cuts, and a scramble among rivals.
- PDD Holdings (Temu’s parent) is under pressure as its U.S. growth engine stalls. Meta could also feel a hit because Temu was a major ad buyer. Meanwhile, Amazon and other domestic or non-Chinese rivals may gain ground if Temu and Shein pull back.
- Analysts suggest reassessing exposure to the likes of PDD or Chinese e-commerce. Rising tariffs and the end of duty-free shipping are squeezing Temu’s U.S. growth engine. They’re looking at U.S.-based retail or ad platforms poised to capture Temu’s lost traffic, like Amazon or Etsy .
⛈️ A Strategy for Stormy Markets
Once upon a time, the 60/40 portfolio was the gold standard for asset allocation.
60% in equities for growth, 40% in bonds for income and downside protection. Simple, effective, and widely used.
Then came a more nuanced approach: risk parity . Instead of dividing assets by dollar amount, it focuses on balancing the risk contribution of each asset class—usually measured by volatility. That shift opened the door to a broader range of assets, including commodities, real estate, inflation-linked bonds, and alternatives.
To keep lower-volatility assets (like bonds) from being overshadowed, leverage is sometimes used to amplify their impact. It can get technical, but the underlying principle is straightforward: diversify risk, not just assets .
💡 That’s the thinking behind the All-Weather Strategy , developed over 25 years by Bridgewater Associates and launched in 1996. The idea? Build a portfolio resilient enough to handle a variety of economic environments.
🌦️ Investing Across Four Seasons
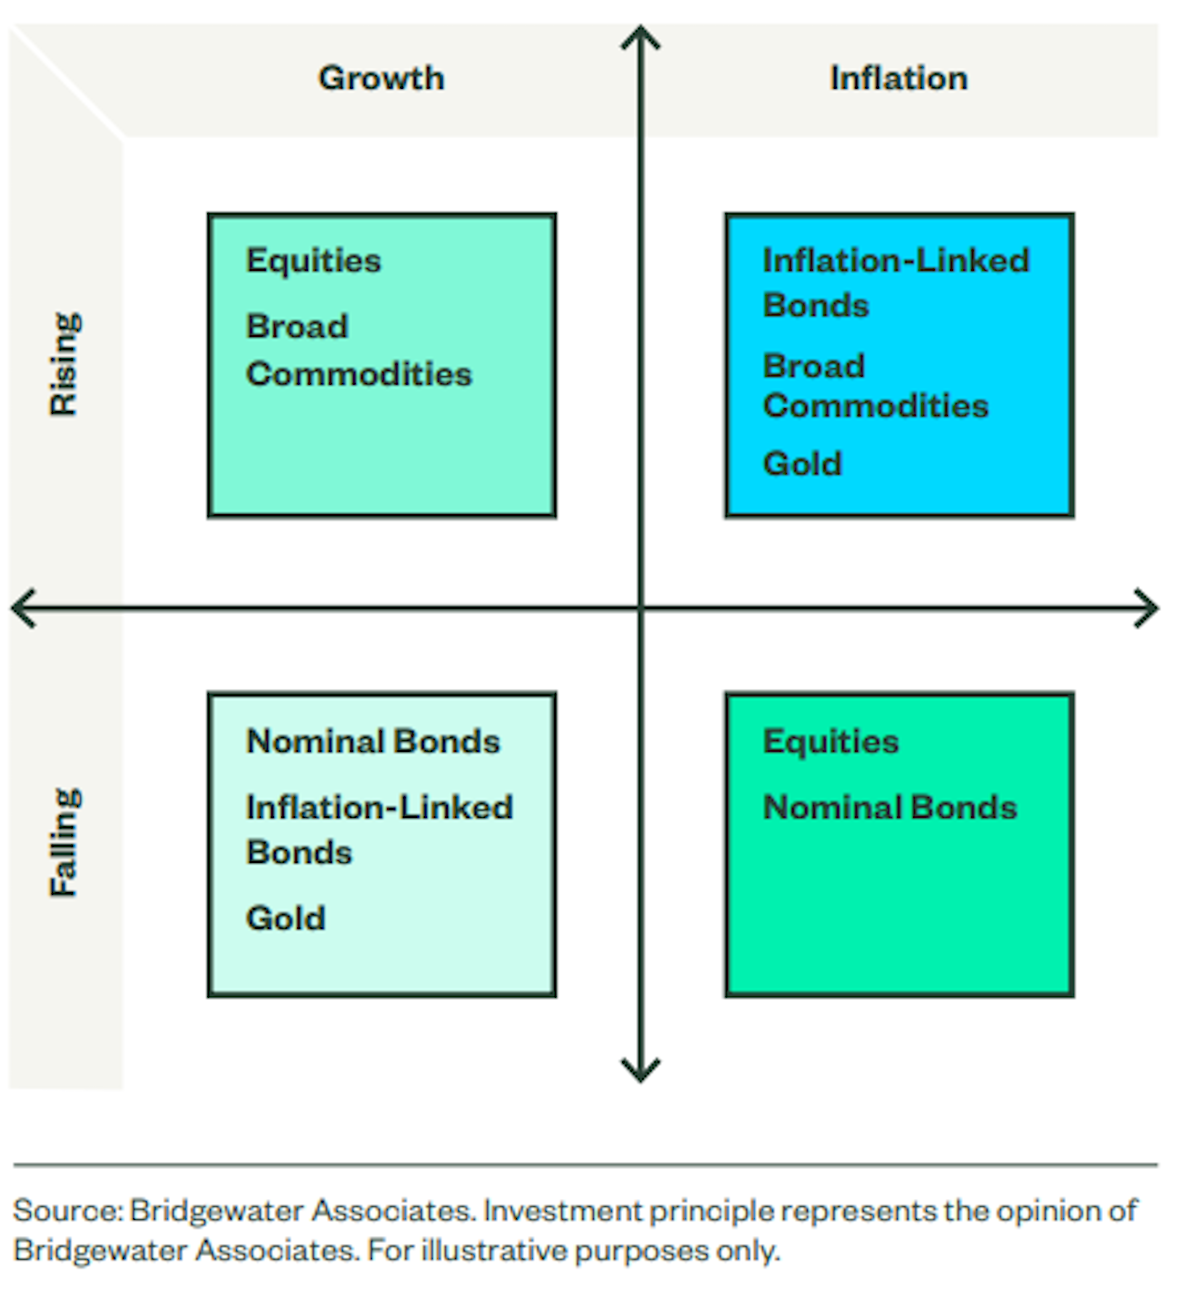
At its core, the all-weather approach is driven by two key forces: economic growth and inflation .
Each can move up or down, and it’s the expectation of those movements that drives asset prices. This creates four basic “seasons” or economic environments, each favoring different types of investments.
📊 The Four Economic Seasons and What Tends to Outperform
- ☝️ Rising Inflation: Commodities (like oil and gold) and inflation-linked bonds tend to hold up well.
- 👇 Falling Inflation / Deflation: Long-term government bonds typically perform strongly.
- 📈 Rising Growth: Equities and other growth-focused assets tend to outperform.
- 📉 Falling Growth: Government bonds often become the go-to safe havens, with rates likely to fall.
In the real world, we often see blends of these scenarios. CSS Analytics describes these periods as:
- 👧🏼 Goldilocks: Rising growth, falling inflation
- 🎈 Reflation: Rising growth, rising inflation
- ✋ Stagflation: Falling growth, rising inflation
- 💨 Deflation: Falling growth, falling inflation
While the first two tend to support equities and risk assets, portfolios also need to account for less favorable environments like stagflation and deflation.
✨ The main idea is to spread risk across assets that historically perform well in each of the four seasons.
📊 Typical Allocations
Here’s a typical allocation breakdown:
- Long-Term Treasury Bonds: 40%
- Intermediate-Term Treasury Bonds: 15%
- Equities: 30%
- Gold: 7.5%
- Commodities: 7.5%
This blend aims to offer more stable performance through various market cycles. Allocations will drift over time, so periodic rebalancing is essential to maintain the intended risk balance.
This mix of assets can easily be adapted to specific countries or globally. ETFs that invest in these asset classes are widely available to investors.
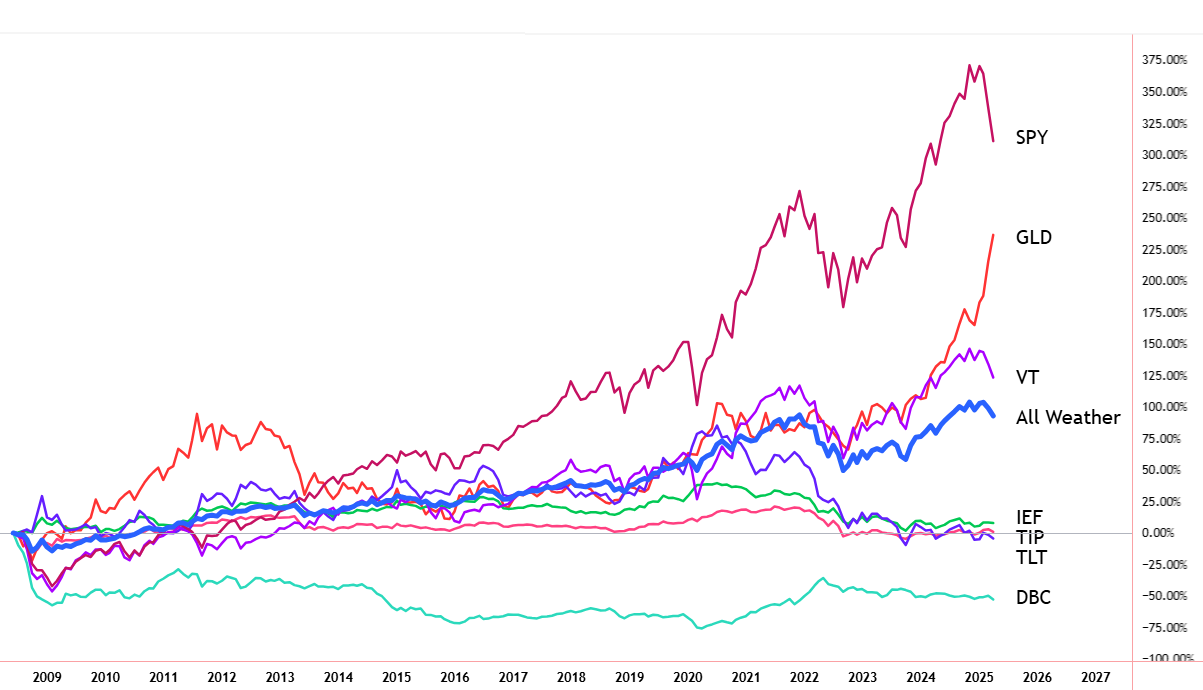
Here’s an example of an All-Weather portfolio using ETFs that have all been around since 2008. The percentages are the relative weighting of each ETF in the portfolio.
- SPDR S&P 500 ETF (SPY) 👉 15%
- Vanguard Total World Stock ETF (VT) 👉 15%
- iShares 20+ Year Treasury Bond ETF (TLT) 👉 20%
- iShares 7-10 Year Treasury Bond ETF (IEF) 👉 15%
- iShares TIPS Bond ETF (TIP) 👉 20%
- Invesco DB Commodity ETF (DBC) 👉 7.5%
- SPDR Gold Trust (GLD) 👉 7.5%
📈 Since 2009, this portfolio has demonstrated solid consistency, especially during market downturns, compared to individual asset classes.
In March, State Street launched ALLW , an ETF built on the All-Weather Strategy and managed in collaboration with Bridgewater Associates.
Unlike the basic version, ALLW is both actively managed and uses leverage . Its latest asset breakdown below (as of April 15, 2025) totals a hefty 182% , thanks to that leverage.
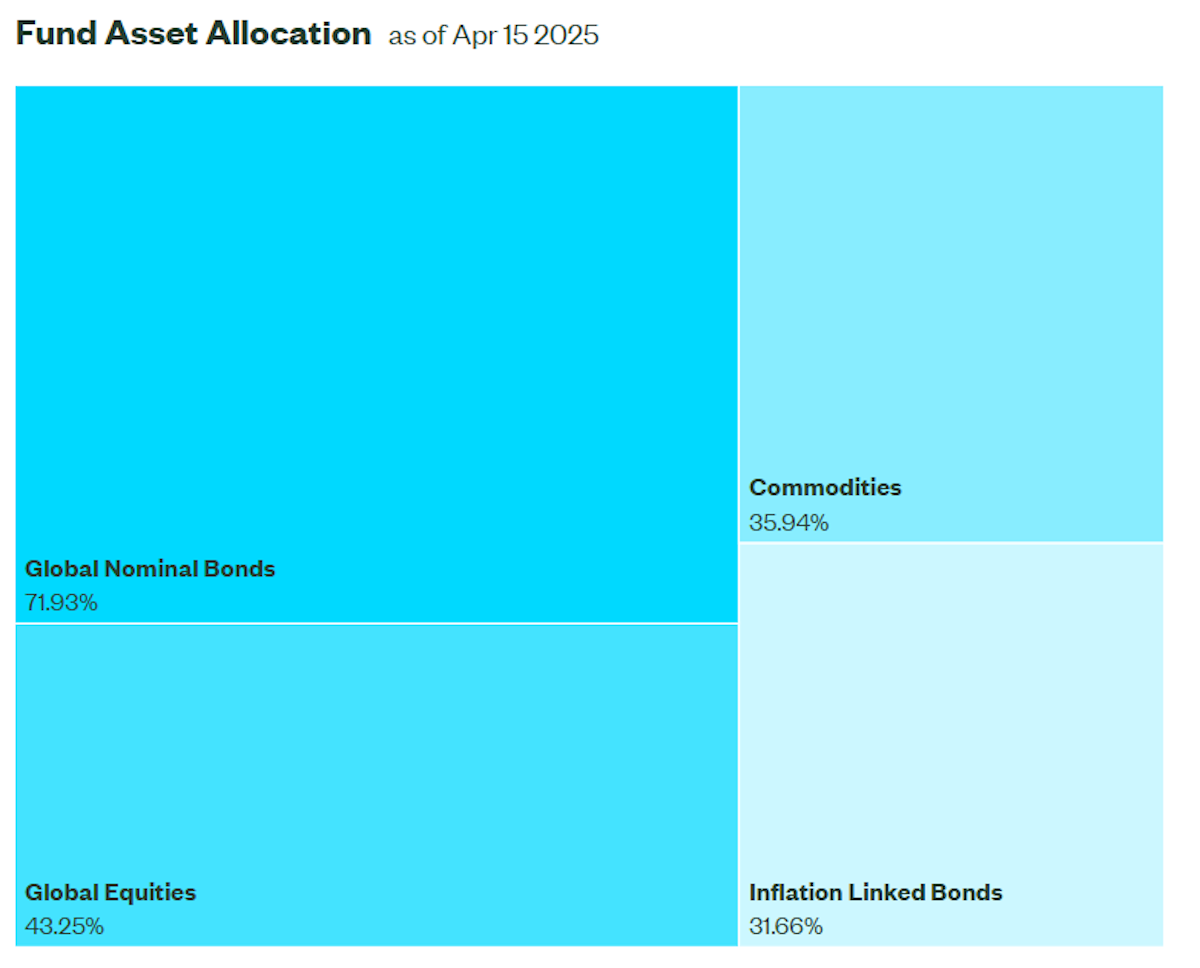
The goal with that is to amplify the exposure of lower-volatility assets while maintaining balanced risk. It’s a more dynamic take on the original idea, but with that comes additional complexity and potential volatility.
Given that the fund is brand new AND is leveraged, it may be worth seeing how it performs over time before diving in…
⚖️ The Pros and Cons of the All-Weather Strategy
Before declaring the All-Weather approach the ultimate portfolio playbook, it’s worth stepping back for a quick reality check. Like any strategy, it comes with trade-offs, especially for investors more used to equity-heavy portfolios.
💪 The Strengths
- ➡️ Rooted in cause and effect, not just correlation
- One of the biggest strengths of the All-Weather Strategy is that it’s built around economic fundamentals—specifically, how different assets respond to changes in growth and inflation. That’s a step up from relying on historical correlations, which can break down during periods of stress.
- 😮💨 Easy to implement (no PhD required)
- If you're sticking to the basics— no leverage —the strategy can be implemented with low-cost, widely available ETFs . That makes it accessible for retail investors looking to diversify beyond just equities.
- 🧘 Flexible and adaptable
- There’s plenty of room to tweak the strategy. Whether it’s adjusting allocations, using different asset classes, or adapting it for global exposure, the core principles remain intact. And yes, we’ll explore some equity-focused adaptations shortly.
🥶 The Weaknesses
- 📊 Lower long-term returns (most of the time)
- The All-Weather portfolio is designed to reduce volatility, not maximize growth. Historical examples show annual returns in the 5–7% range, depending on how far back you look. That’s solid, but it’s not going to outperform a stock-heavy portfolio in a long bull market.
- 🔫 It’s not bulletproof
- Case in point: 2022. Both stocks and bonds fell together, delivering a hit to All-Weather portfolios. When the usual inverse correlation between stocks and bonds breaks down, the strategy loses its key defense.
- 💰 Heavy reliance on bonds
- With a traditional allocation putting 55% in Treasuries, some critics argue the strategy benefited from a historic bond bull market (1980–2020). If the next few decades aren’t as kind to bonds, especially with higher-for-longer interest rates, that large allocation may drag.
That said, the strategy can evolve. There are alternatives to government bonds, equity-focused investors have ways to adapt the core ideas without giving up growth potential entirely.
- With a traditional allocation putting 55% in Treasuries, some critics argue the strategy benefited from a historic bond bull market (1980–2020). If the next few decades aren’t as kind to bonds, especially with higher-for-longer interest rates, that large allocation may drag.
📈 Individual Stocks Can Also Perform Through the Four Seasons
The classic All-Weather portfolio leans on broad asset classes, equities, bonds, and commodities, often accessed through ETFs. It’s simple, diversified, and easy to manage.
But for investors who prefer to roll up their sleeves and build around individual stocks , there’s an opportunity here too.
While single stocks bring more risk, they also bring greater upside potential , especially if you can find companies well-positioned to thrive across different economic conditions.
Using the same four-season framework of growth and inflation, here’s how certain sectors and types of companies tend to stack up:
👧🏼 Goldilocks: Rising Growth, Falling Inflation
This is a sweet spot for risk assets. The economy’s humming along, inflation is under control, and cyclical sectors shine.
- 📦 Consumer Discretionary
- 💻 Technology
- 🏗️ Industrials
- 💳 Financials
These sectors typically benefit from stronger consumer and business spending, and lower inflation means input costs are manageable.
🎈 Reflation: Rising Growth, Rising Inflation
Growth is strong, but prices are heating up too. Most sectors can perform well here, but some stand out.
- 🛢️ Energy – Fuel prices rise with demand, and producers benefit.
- 🏢 Real Estate – Rental income and asset values often rise with inflation.
This combo can be good for real assets and sectors that can pass on costs without hurting demand.
✋ Stagflation: Falling Growth, Rising Inflation
This one’s tougher. Growth slows while inflation lingers—a headwind for many businesses. But some still hold up.
- ⛏️ Commodity Producers – Companies producing goods like oil, metals, and agriculture can benefit from price increases, even with weak demand.
- 🪙 Gold Miners – Benefit from gold’s safe-haven status during uncertainty.
- 🏥 Healthcare , 🛒 Consumer Staples , 🔌 Utilities – Classic defensive sectors that provide essentials, regardless of the economic mood.
💨 Deflation: Falling Growth, Falling Inflation
When both growth and prices are falling, safety and quality take priority.
- 💸 High-Quality Dividend Stocks – Especially in utilities and healthcare, where earnings are stable and demand is steady.
- 📈 High-Quality Growth Stocks – Companies with long-term earnings potential often see valuations rise as interest rates fall and future cash flows become more valuable.
These stocks aren’t immune to volatility, but in a low-rate, low-growth world, they can still shine—especially if they have strong balance sheets and pricing power.
📌 Bottom line: You don’t have to stick to ETFs or indexes to follow an all-weather mindset.
By understanding how sectors and companies respond to different environments, investors can build resilient, stock-focused portfolios that still respect the macro backdrop.
💡 The Insight: Use the Portfolio Tool to Manage Several Portfolios with Different Objectives
As we've seen, the All-Weather Strategy leans more toward capital preservation than high-octane growth. That’s not a weakness—it’s just a matter of fit. The key is knowing what you're aiming for , and choosing the right tools for the job.
If your top priority is protecting capital , then managing volatility becomes essential. But if you're younger or earlier in your investing journey, your sights may be set more on capital growth , and you’ve got time to ride out the inevitable market dips.
🚦 Here’s a simple but powerful idea: run multiple strategies side by side.
Think of your investments as buckets:
- 🛡️ A Capital Protection Bucket - with strategies like All-Weather, more bonds, less volatility.
- 🚀 A Growth Bucket - equity-heavy, more risk, but with higher long-term potential.
How you divide your capital between them will depend on where you are in life, your goals, and your comfort with risk.
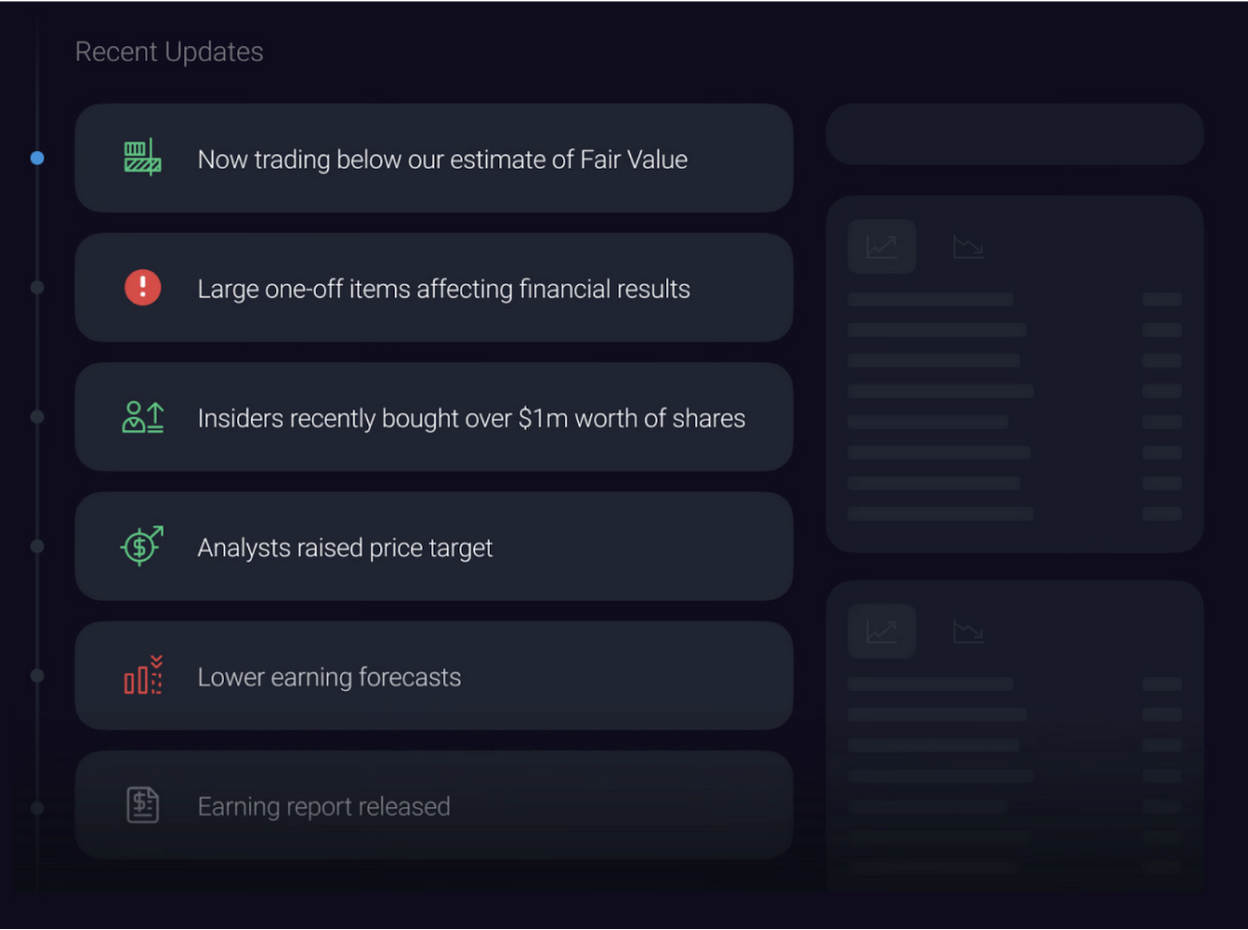
📊 That’s where the Simply Wall St Portfolio Tool can help.
.PNG)
It lets you create and track multiple portfolios, each with its own objective and risk profile .
One might be a stock portfolio where you're focused on growth, taking calculated risks and ok with some losses. The other could be your retirement account with the all-weather approach, able to handle any environment but it grows at a slower pace.
You can monitor them individually, compare performance, review forecasted income, or zoom out and see how everything fits together in one big-picture view .
Whether you're balancing between weatherproofing and growth, or experimenting with new strategies, the ability to manage multiple portfolios gives you more flexibility, more clarity, and more control.
Simply sync with your brokerage account and never miss a beat with important updates sent straight to you. For all 7 reasons you’ll be better off using this tool, check out our features page .
Key Events During the Next Week
Wednesday
- 🇩🇪 Germany Manufacturing PMI Flash (APR)
- 📉 Forecast: 49.1, up from 48.3
- Why it matters 👉 : Improvement in Germany’s factory activity would be a positive sign for the eurozone’s largest economy. A beat could support European equities and the euro.
- 🇬🇧 UK Manufacturing PMI Flash (APR)
- 📉 Forecast: 46.8, up from 44.9
- Why it matters 👉 : The sector is still in contraction, but momentum is improving. A stronger read could lift UK industrials and push bond yields higher.
- 🇬🇧 UK Services PMI Flash (APR)
- 📊 Previous: 52.5
- Why it matters 👉 : Services are keeping the UK economy afloat. Continued expansion may delay Bank of England rate cuts, affecting domestic stocks and the pound.
Thursday
- 🇩🇪 Germany Ifo Business Climate (APR)
- 📈 Forecast: 88.5, up from 86.7
- Why it matters 👉 : A rebound in business confidence would signal improving sentiment in Europe’s growth engine. It’s a key indicator to watch for signs of recovery.
- 🇺🇸 US Durable Goods Orders MoM (MAR)
- 📉 Forecast: -0.5%, down from +0.9%
- Why it matters 👉 : A slowdown could point to softer business investment. Markets may interpret a weak print as another reason for the Fed to lean dovish.
- 🇺🇸 US Existing Home Sales (MAR)
- 🏘️ Forecast: 4.38M, up from 4.26M
- Why it matters 👉 : Housing is one of the first sectors to feel interest rate changes. A rebound may ease recession fears but push back expectations for Fed cuts.
Friday
- 🇬🇧 UK Retail Sales MoM (MAR)
- 🛒 Forecast: -0.3%, down from +1%
- Why it matters 👉 : A drop in consumer spending could weigh on UK GDP expectations. Weakness here would increase pressure on the BoE to consider easing sooner.
It’s the first big week for Q1 earnings, with three of the Magnificent 7 reporting, along with numerous other companies:
Have feedback on this article? Concerned about the content? Get in touch with us directly. Alternatively, email editorial-team@simplywallst.com
Simply Wall St analyst Richard Bowman and Simply Wall St have no position in any of the companies mentioned. This article is general in nature. We provide commentary based on historical data and analyst forecasts only using an unbiased methodology and our articles are not intended to be financial advice. It does not constitute a recommendation to buy or sell any stock and does not take account of your objectives, or your financial situation. We aim to bring you long-term focused analysis driven by fundamental data. Note that our analysis may not factor in the latest price-sensitive company announcements or qualitative material.
Richard Bowman
Richard is an analyst, writer and investor based in Cape Town, South Africa. He has written for several online investment publications and continues to do so. Richard is fascinated by economics, financial markets and behavioral finance. He is also passionate about tools and content that make investing accessible to everyone.
