- United States
- /
- Banks
- /
- NasdaqCM:FNWD
Despite the downward trend in earnings at Finward Bancorp (NASDAQ:FNWD) the stock surges 12%, bringing one-year gains to 46%


The simplest way to invest in stocks is to buy exchange traded funds. But if you pick the right individual stocks, you could make more than that. To wit, the Finward Bancorp (NASDAQ:FNWD) share price is 44% higher than it was a year ago, much better than the market return of around 31% (not including dividends) in the same period. If it can keep that out-performance up over the long term, investors will do very well! On the other hand, longer term shareholders have had a tougher run, with the stock falling 23% in three years.
The past week has proven to be lucrative for Finward Bancorp investors, so let's see if fundamentals drove the company's one-year performance.
View our latest analysis for Finward Bancorp
While the efficient markets hypothesis continues to be taught by some, it has been proven that markets are over-reactive dynamic systems, and investors are not always rational. One way to examine how market sentiment has changed over time is to look at the interaction between a company's share price and its earnings per share (EPS).
During the last year, Finward Bancorp actually saw its earnings per share drop 1.3%.
We don't think that the decline in earnings per share is a good measure of the business over the last twelve months. It makes sense to check some of the other fundamental data for an explanation of the share price rise.
We are skeptical of the suggestion that the 1.5% dividend yield would entice buyers to the stock. Revenue was pretty stable on last year, so deeper research might be needed to explain the share price rise.
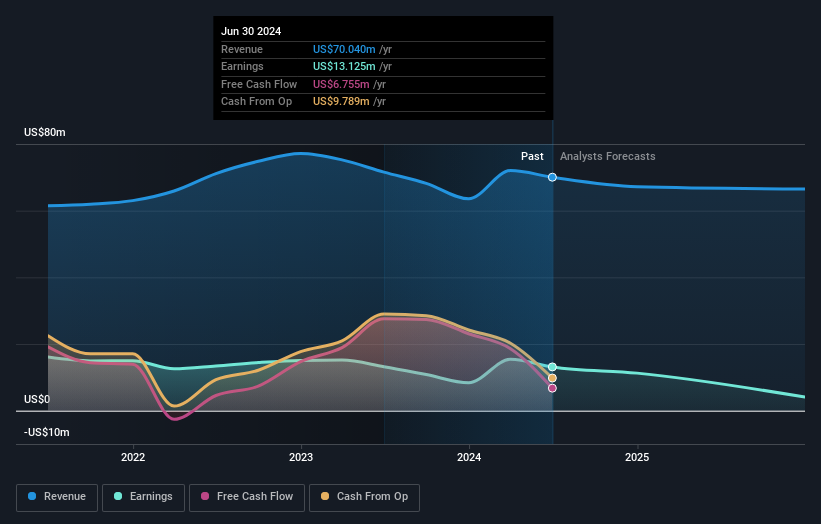
The company's revenue and earnings (over time) are depicted in the image below (click to see the exact numbers).
Balance sheet strength is crucial. It might be well worthwhile taking a look at our free report on how its financial position has changed over time.
What About Dividends?
As well as measuring the share price return, investors should also consider the total shareholder return (TSR). The TSR incorporates the value of any spin-offs or discounted capital raisings, along with any dividends, based on the assumption that the dividends are reinvested. So for companies that pay a generous dividend, the TSR is often a lot higher than the share price return. As it happens, Finward Bancorp's TSR for the last 1 year was 46%, which exceeds the share price return mentioned earlier. And there's no prize for guessing that the dividend payments largely explain the divergence!
A Different Perspective
It's nice to see that Finward Bancorp shareholders have received a total shareholder return of 46% over the last year. Of course, that includes the dividend. That certainly beats the loss of about 3% per year over the last half decade. This makes us a little wary, but the business might have turned around its fortunes. While it is well worth considering the different impacts that market conditions can have on the share price, there are other factors that are even more important. Take risks, for example - Finward Bancorp has 2 warning signs (and 1 which makes us a bit uncomfortable) we think you should know about.
If you like to buy stocks alongside management, then you might just love this free list of companies. (Hint: many of them are unnoticed AND have attractive valuation).
Please note, the market returns quoted in this article reflect the market weighted average returns of stocks that currently trade on American exchanges.
New: AI Stock Screener & Alerts
Our new AI Stock Screener scans the market every day to uncover opportunities.
• Dividend Powerhouses (3%+ Yield)
• Undervalued Small Caps with Insider Buying
• High growth Tech and AI Companies
Or build your own from over 50 metrics.
Have feedback on this article? Concerned about the content? Get in touch with us directly. Alternatively, email editorial-team (at) simplywallst.com.
This article by Simply Wall St is general in nature. We provide commentary based on historical data and analyst forecasts only using an unbiased methodology and our articles are not intended to be financial advice. It does not constitute a recommendation to buy or sell any stock, and does not take account of your objectives, or your financial situation. We aim to bring you long-term focused analysis driven by fundamental data. Note that our analysis may not factor in the latest price-sensitive company announcements or qualitative material. Simply Wall St has no position in any stocks mentioned.
About NasdaqCM:FNWD
Finward Bancorp
Operates as the holding company for Peoples Bank that provides various banking products and services.
Flawless balance sheet and good value.
