
Key Insights
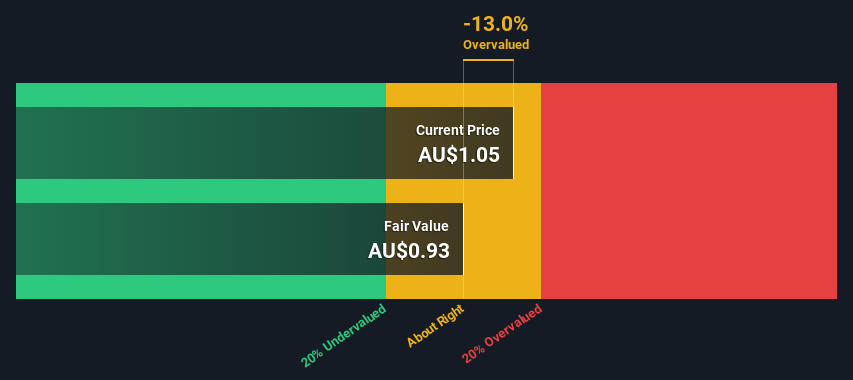
- The projected fair value for Core Lithium is AU$0.93 based on 2 Stage Free Cash Flow to Equity
- Core Lithium's AU$1.05 share price indicates it is trading at similar levels as its fair value estimate
- The AU$0.91 analyst price target for CXO is 2.2% less than our estimate of fair value
Today we'll do a simple run through of a valuation method used to estimate the attractiveness of Core Lithium Ltd (ASX:CXO) as an investment opportunity by projecting its future cash flows and then discounting them to today's value. One way to achieve this is by employing the Discounted Cash Flow (DCF) model. It may sound complicated, but actually it is quite simple!
We generally believe that a company's value is the present value of all of the cash it will generate in the future. However, a DCF is just one valuation metric among many, and it is not without flaws. If you want to learn more about discounted cash flow, the rationale behind this calculation can be read in detail in the Simply Wall St analysis model.
Check out our latest analysis for Core Lithium
What's The Estimated Valuation?
We are going to use a two-stage DCF model, which, as the name states, takes into account two stages of growth. The first stage is generally a higher growth period which levels off heading towards the terminal value, captured in the second 'steady growth' period. In the first stage we need to estimate the cash flows to the business over the next ten years. Where possible we use analyst estimates, but when these aren't available we extrapolate the previous free cash flow (FCF) from the last estimate or reported value. We assume companies with shrinking free cash flow will slow their rate of shrinkage, and that companies with growing free cash flow will see their growth rate slow, over this period. We do this to reflect that growth tends to slow more in the early years than it does in later years.
Generally we assume that a dollar today is more valuable than a dollar in the future, so we discount the value of these future cash flows to their estimated value in today's dollars:
10-year free cash flow (FCF) forecast
| 2023 | 2024 | 2025 | 2026 | 2027 | 2028 | 2029 | 2030 | 2031 | 2032 | |
| Levered FCF (A$, Millions) | -AU$61.5m | AU$172.0m | AU$248.5m | AU$131.0m | AU$128.8m | AU$128.2m | AU$128.5m | AU$129.5m | AU$130.9m | AU$132.7m |
| Growth Rate Estimate Source | Analyst x4 | Analyst x4 | Analyst x4 | Analyst x2 | Analyst x2 | Est @ -0.48% | Est @ 0.25% | Est @ 0.77% | Est @ 1.12% | Est @ 1.37% |
| Present Value (A$, Millions) Discounted @ 8.5% | -AU$56.7 | AU$146 | AU$195 | AU$94.6 | AU$85.8 | AU$78.7 | AU$72.7 | AU$67.6 | AU$63.0 | AU$58.9 |
("Est" = FCF growth rate estimated by Simply Wall St)
Present Value of 10-year Cash Flow (PVCF) = AU$805m
After calculating the present value of future cash flows in the initial 10-year period, we need to calculate the Terminal Value, which accounts for all future cash flows beyond the first stage. The Gordon Growth formula is used to calculate Terminal Value at a future annual growth rate equal to the 5-year average of the 10-year government bond yield of 2.0%. We discount the terminal cash flows to today's value at a cost of equity of 8.5%.
Terminal Value (TV)= FCF2032 × (1 + g) ÷ (r – g) = AU$133m× (1 + 2.0%) ÷ (8.5%– 2.0%) = AU$2.1b
Present Value of Terminal Value (PVTV)= TV / (1 + r)10= AU$2.1b÷ ( 1 + 8.5%)10= AU$921m
The total value is the sum of cash flows for the next ten years plus the discounted terminal value, which results in the Total Equity Value, which in this case is AU$1.7b. To get the intrinsic value per share, we divide this by the total number of shares outstanding. Compared to the current share price of AU$1.1, the company appears around fair value at the time of writing. The assumptions in any calculation have a big impact on the valuation, so it is better to view this as a rough estimate, not precise down to the last cent.
Important Assumptions
Now the most important inputs to a discounted cash flow are the discount rate, and of course, the actual cash flows. Part of investing is coming up with your own evaluation of a company's future performance, so try the calculation yourself and check your own assumptions. The DCF also does not consider the possible cyclicality of an industry, or a company's future capital requirements, so it does not give a full picture of a company's potential performance. Given that we are looking at Core Lithium as potential shareholders, the cost of equity is used as the discount rate, rather than the cost of capital (or weighted average cost of capital, WACC) which accounts for debt. In this calculation we've used 8.5%, which is based on a levered beta of 1.096. Beta is a measure of a stock's volatility, compared to the market as a whole. We get our beta from the industry average beta of globally comparable companies, with an imposed limit between 0.8 and 2.0, which is a reasonable range for a stable business.
SWOT Analysis for Core Lithium
- Currently debt free.
- Current share price is above our estimate of fair value.
- Shareholders have been diluted in the past year.
- Expected to breakeven next year.
- Has less than 3 years of cash runway based on current free cash flow.
Moving On:
Although the valuation of a company is important, it shouldn't be the only metric you look at when researching a company. DCF models are not the be-all and end-all of investment valuation. Rather it should be seen as a guide to "what assumptions need to be true for this stock to be under/overvalued?" If a company grows at a different rate, or if its cost of equity or risk free rate changes sharply, the output can look very different. For Core Lithium, we've put together three further elements you should consider:
- Risks: You should be aware of the 4 warning signs for Core Lithium (1 can't be ignored!) we've uncovered before considering an investment in the company.
- Future Earnings: How does CXO's growth rate compare to its peers and the wider market? Dig deeper into the analyst consensus number for the upcoming years by interacting with our free analyst growth expectation chart.
- Other Solid Businesses: Low debt, high returns on equity and good past performance are fundamental to a strong business. Why not explore our interactive list of stocks with solid business fundamentals to see if there are other companies you may not have considered!
PS. Simply Wall St updates its DCF calculation for every Australian stock every day, so if you want to find the intrinsic value of any other stock just search here.
The New Payments ETF Is Live on NASDAQ:
Money is moving to real-time rails, and a newly listed ETF now gives investors direct exposure. Fast settlement. Institutional custody. Simple access.
Explore how this launch could reshape portfolios
Sponsored ContentNew: AI Stock Screener & Alerts
Our new AI Stock Screener scans the market every day to uncover opportunities.
• Dividend Powerhouses (3%+ Yield)
• Undervalued Small Caps with Insider Buying
• High growth Tech and AI Companies
Or build your own from over 50 metrics.
Have feedback on this article? Concerned about the content? Get in touch with us directly. Alternatively, email editorial-team (at) simplywallst.com.
This article by Simply Wall St is general in nature. We provide commentary based on historical data and analyst forecasts only using an unbiased methodology and our articles are not intended to be financial advice. It does not constitute a recommendation to buy or sell any stock, and does not take account of your objectives, or your financial situation. We aim to bring you long-term focused analysis driven by fundamental data. Note that our analysis may not factor in the latest price-sensitive company announcements or qualitative material. Simply Wall St has no position in any stocks mentioned.
About ASX:CXO
Core Lithium
Engages in the development of lithium and various metal deposits in Northern Territory and South Australia.
Excellent balance sheet with moderate growth potential.
Similar Companies
Market Insights

Weekly Picks

THE KINGDOM OF BROWN GOODS: WHY MGPI IS BEING CRUSHED BY INVENTORY & PRIMED FOR RESURRECTION


Why Vertical Aerospace (NYSE: EVTL) is Worth Possibly Over 13x its Current Price


The Quiet Giant That Became AI’s Power Grid
Recently Updated Narratives


MINISO's fair value is projected at 26.69 with an anticipated PE ratio shift of 20x

Fiverr International will transform the freelance industry with AI-powered growth

Jackson Financial Stock: When Insurance Math Meets a Shifting Claims Landscape
Popular Narratives


MicroVision will explode future revenue by 380.37% with a vision towards success


Crazy Undervalued 42 Baggers Silver Play (Active & Running Mine)


