Advertisement
- United States
- /
- Software
- /
- NasdaqGS:FTNT
Has The Pullback In Fortinet (FTNT) Opened A New Valuation Opportunity?

Reviewed by Bailey Pemberton
- If you are looking at Fortinet and wondering whether the current share price really reflects its underlying value, this article is designed to walk you through that question step by step.
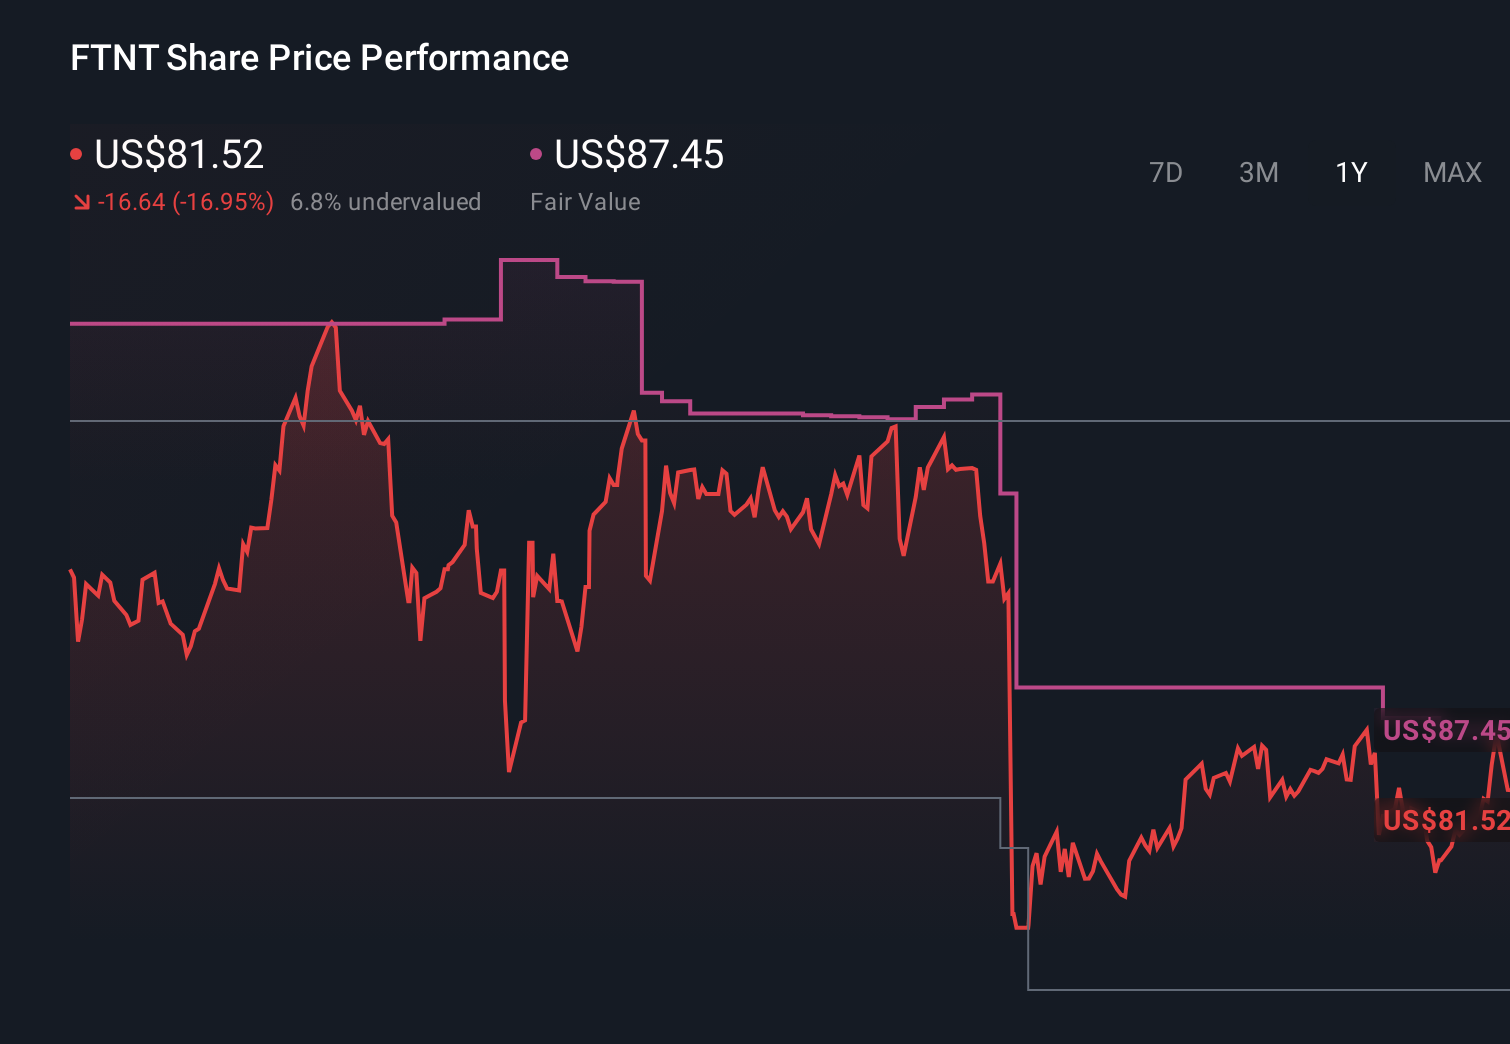
- The stock closed at US$76.32, with returns of a 2.2% decline over 7 days, 7.5% decline over 30 days, 2.0% decline year to date, 18.9% decline over 1 year, 57.6% over 3 years and 154.8% over 5 years, which can change how investors think about both risk and upside.
- Recent news coverage around Fortinet has largely focused on its position in cybersecurity and how investors are reacting to that story over different timeframes. This mix of shorter term pullbacks and stronger multi year returns is an important backdrop when you are trying to decide whether the current price still makes sense.
- Simply Wall St currently gives Fortinet a valuation score of 5 out of 6, which we will unpack using different valuation approaches before circling back at the end of the article to a more practical way you can keep on top of its valuation over time.
Find out why Fortinet's -18.9% return over the last year is lagging behind its peers.
Approach 1: Fortinet Discounted Cash Flow (DCF) Analysis
A Discounted Cash Flow, or DCF, model takes projected future cash flows and discounts them back to today, so you can compare that stream of cash to the current share price in a consistent way.
For Fortinet, the model used is a 2 Stage Free Cash Flow to Equity approach based on cash flow projections. The latest twelve month Free Cash Flow is about $2.10b. Analyst estimates and Simply Wall St extrapolations project Free Cash Flow rising to around $4.10b by 2030, with interim annual figures between 2026 and 2035 discounted back to today to reflect risk and the time value of money.
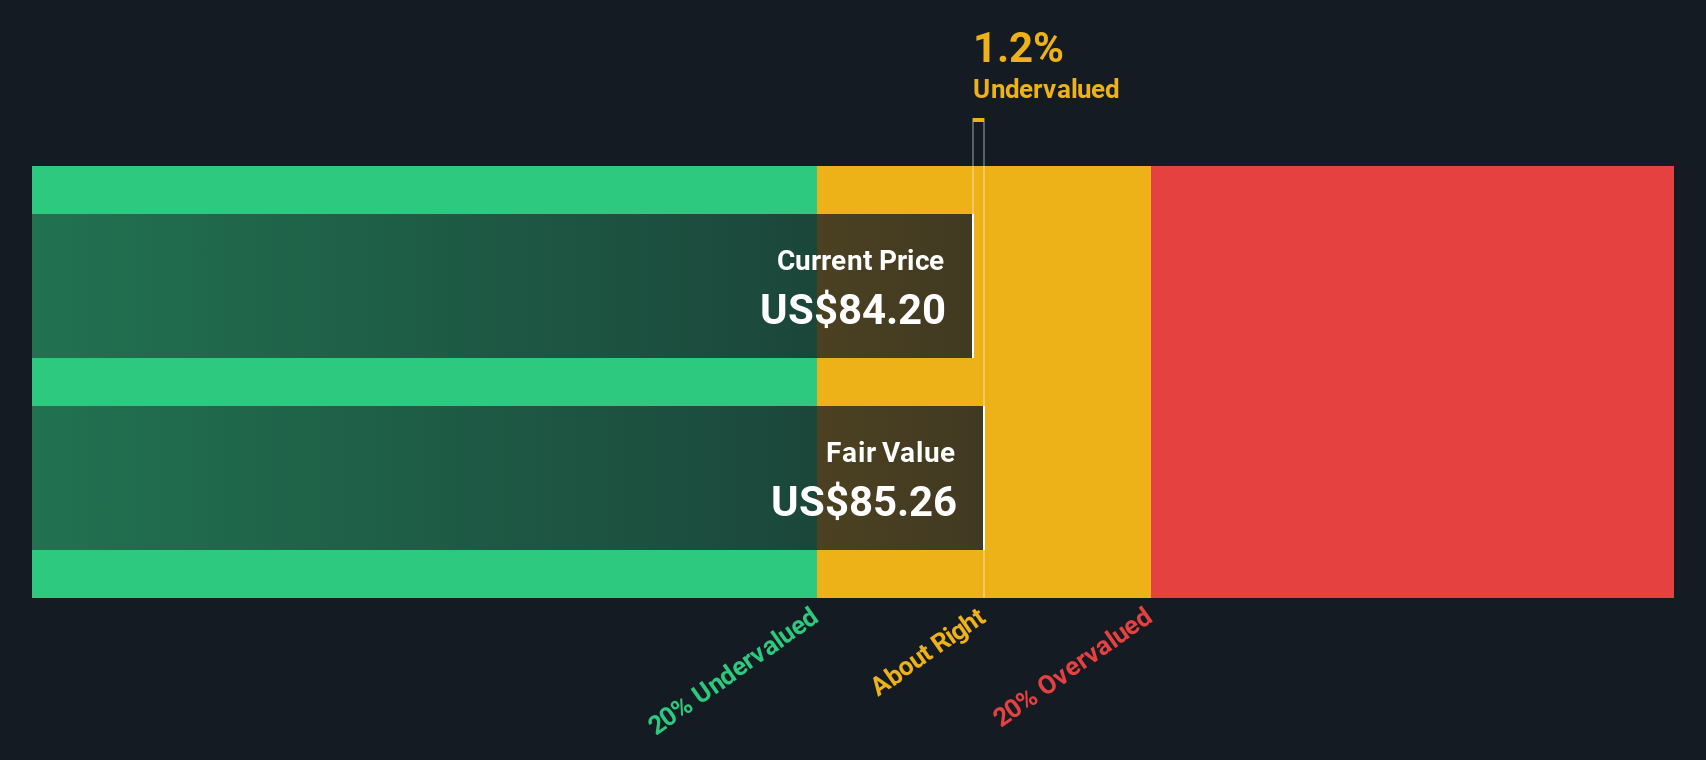
When all those projected cash flows are added up and discounted, the model arrives at an estimated intrinsic value of about $101.44 per share. Compared with the recent share price of $76.32, this indicates Fortinet is 24.8% undervalued on this DCF view.
Result: UNDERVALUED
Our Discounted Cash Flow (DCF) analysis suggests Fortinet is undervalued by 24.8%. Track this in your watchlist or portfolio, or discover 868 more undervalued stocks based on cash flows.
Approach 2: Fortinet Price vs Earnings
For a profitable company like Fortinet, the P/E ratio is a useful yardstick because it links what you pay per share to the earnings the business is currently generating. It is a simple way to see how much the market is paying for each dollar of profit.
What counts as a “normal” P/E depends on what investors expect for growth and how much risk they see in those earnings. Higher expected growth or lower perceived risk can support a higher P/E, while slower growth or higher risk tends to justify a lower one.
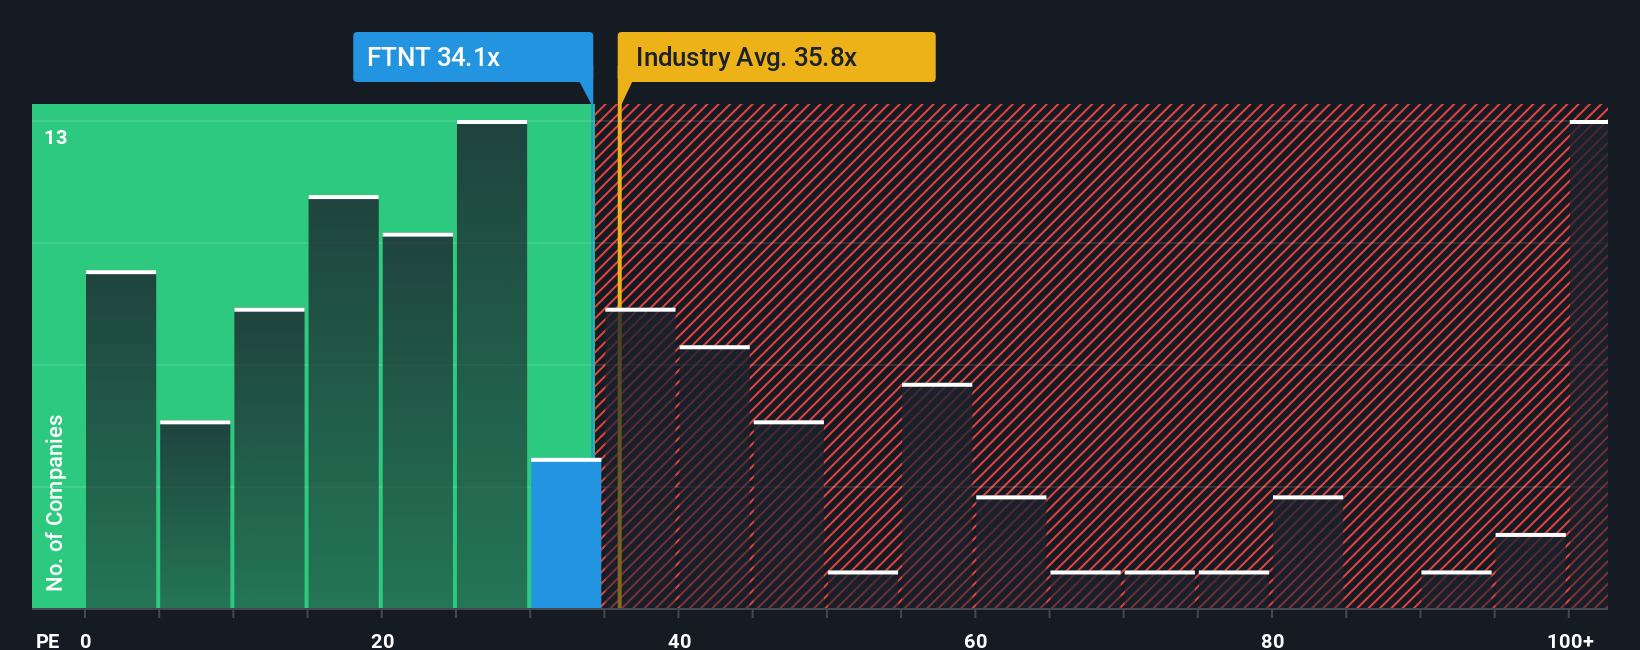
Fortinet trades on a P/E of 30.29x. That is close to the broader Software industry average of 31.77x and below the peer average of 61.09x. Simply Wall St also calculates a proprietary “Fair Ratio” of 34.64x for Fortinet, which is the P/E level it estimates would be reasonable given factors like earnings growth, margins, industry, market cap and company specific risks.
This Fair Ratio is more tailored than a simple peer or industry comparison because it adjusts for Fortinet’s own characteristics rather than assuming all software stocks deserve the same multiple. Comparing 30.29x to the Fair Ratio of 34.64x suggests the shares look undervalued on this P/E based view.
Result: UNDERVALUED
P/E ratios tell one story, but what if the real opportunity lies elsewhere? Discover 1440 companies where insiders are betting big on explosive growth.
Upgrade Your Decision Making: Choose your Fortinet Narrative
Earlier we mentioned that there is an even better way to understand valuation. Let us introduce you to Narratives, which are simple stories that you and other investors create to link Fortinet’s business outlook to a financial forecast and then to a fair value, all within Simply Wall St’s Community page that is used by millions of investors.
Each Narrative combines your view on Fortinet’s revenue, earnings and margins with your own fair value estimate, then sets that against the current share price so you can quickly see whether you think the stock looks cheap or expensive and decide if it might be a time to add, trim or wait.
Narratives update automatically as new information comes in. When fresh earnings, guidance or news about areas like AI data center security or hardware risks are added, your forecast and fair value are refreshed without you needing to rebuild a model from scratch.
For example, one Fortinet Narrative on Simply Wall St currently anchors on a fair value of about US$99.03 per share, while another sits closer to US$87.04. This shows how two well informed investors can look at the same company, plug in different assumptions and arrive at different but transparent views on what Fortinet is worth today.
Do you think there's more to the story for Fortinet? Head over to our Community to see what others are saying!
This article by Simply Wall St is general in nature. We provide commentary based on historical data and analyst forecasts only using an unbiased methodology and our articles are not intended to be financial advice. It does not constitute a recommendation to buy or sell any stock, and does not take account of your objectives, or your financial situation. We aim to bring you long-term focused analysis driven by fundamental data. Note that our analysis may not factor in the latest price-sensitive company announcements or qualitative material. Simply Wall St has no position in any stocks mentioned.
New: AI Stock Screener & Alerts
Our new AI Stock Screener scans the market every day to uncover opportunities.
• Dividend Powerhouses (3%+ Yield)
• Undervalued Small Caps with Insider Buying
• High growth Tech and AI Companies
Or build your own from over 50 metrics.
Have feedback on this article? Concerned about the content? Get in touch with us directly. Alternatively, email editorial-team@simplywallst.com
About NasdaqGS:FTNT
Fortinet
Provides cybersecurity and convergence of networking and security solutions worldwide.
Excellent balance sheet with acceptable track record.
Similar Companies
Market Insights


Advertisement
Weekly Picks
ST


stuart_roberts on Upside Gold ·
An Undervalued 3.3Moz Gold Project in Canada
Fair Value:CA$5.0776.3% undervalued
151 followersusers have followed this narrative
1 commentusers have commented on this narrative
25 likesusers have liked this narrative
CL


Clive_Thompson on Hermès International Société en commandite par actions ·
Hermès - Expensive bags, and expensive stock. And the story of €14 billion of bearer shares gone missing.
Fair Value:€1.51k22.9% overvalued
14 followersusers have followed this narrative
1 commentusers have commented on this narrative
21 likesusers have liked this narrative
SU

superbullll on Cheniere Energy ·
Cheniere Energy (LNG) — The Toll Road That Geopolitics Just Made More Valuable
Fair Value:US$320.9417.0% undervalued
16 followersusers have followed this narrative
0 commentsusers have commented on this narrative
6 likesusers have liked this narrative
SA

Salman2415 on GNG Electronics ·
Strong execution in a growing category, but long‑term value hinges on cash‑flow discipline
Fair Value:₹135.87178.3% overvalued
7 followersusers have followed this narrative
1 commentusers have commented on this narrative
2 likesusers have liked this narrative
Recently Updated Narratives
GE

Germaine on Mega Fortris Berhad ·
The Global Standard: Mega Fortris Solidifies Global Leadership Amidst Resilient Market Performance
Fair Value:RM 0.8247.6% overvalued
1 followerusers have followed this narrative
0 commentsusers have commented on this narrative
0 likesusers have liked this narrative
FA

FA_Trader on A1 A.K. Koh Group Berhad ·
A1 A.K. Koh Group Berhad: A simple local food story that could ride on Visit Malaysia 2026
Fair Value:RM 0.3342.4% undervalued
1 followerusers have followed this narrative
0 commentsusers have commented on this narrative
0 likesusers have liked this narrative
FA

FA_Trader on Vanzo Holdings Berhad ·
Vanzo Holdings Berhad: Small consumer brand, but fundamentals are getting more interesting
Fair Value:RM 0.2240.9% undervalued
1 followerusers have followed this narrative
0 commentsusers have commented on this narrative
0 likesusers have liked this narrative
Popular Narratives
KA

kabz2342 on Nu Holdings ·
Nu holdings will continue to disrupt the South American banking market
Fair Value:US$64.378.3% undervalued
55 followersusers have followed this narrative
3 commentsusers have commented on this narrative
29 likesusers have liked this narrative
YA

Yang_ on SoFi Technologies ·
SoFi Technologies: The Apex Aggregator and the Infrastructure of the Modern Financial System
Fair Value:US$22.9825.2% undervalued
46 followersusers have followed this narrative
0 commentsusers have commented on this narrative
34 likesusers have liked this narrative
AN


AnalystConsensusTarget on Microsoft ·
Analyst Commentary Highlights Microsoft AI Momentum and Upward Valuation Amid Growth and Competitive Risks
Fair Value:US$594.6234.1% undervalued
1313 followersusers have followed this narrative
2 commentsusers have commented on this narrative
10 likesusers have liked this narrative


