
Advertisement
- United States
- /
- Specialty Stores
- /
- NYSE:W
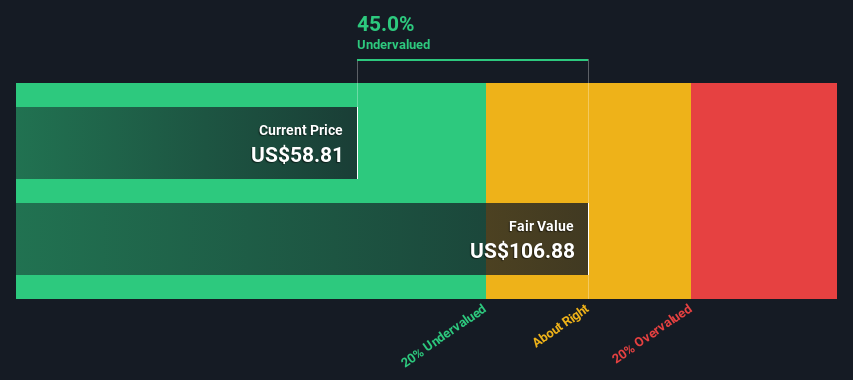
Wayfair Inc. (NYSE:W) Shares Could Be 45% Below Their Intrinsic Value Estimate

Key Insights
- The projected fair value for Wayfair is US$107 based on 2 Stage Free Cash Flow to Equity
- Wayfair is estimated to be 45% undervalued based on current share price of US$58.81
- The US$67.75 analyst price target for W is 37% less than our estimate of fair value
In this article we are going to estimate the intrinsic value of Wayfair Inc. (NYSE:W) by taking the expected future cash flows and discounting them to their present value. We will take advantage of the Discounted Cash Flow (DCF) model for this purpose. Don't get put off by the jargon, the math behind it is actually quite straightforward.
We would caution that there are many ways of valuing a company and, like the DCF, each technique has advantages and disadvantages in certain scenarios. For those who are keen learners of equity analysis, the Simply Wall St analysis model here may be something of interest to you.
Check out our latest analysis for Wayfair
Step By Step Through The Calculation
We are going to use a two-stage DCF model, which, as the name states, takes into account two stages of growth. The first stage is generally a higher growth period which levels off heading towards the terminal value, captured in the second 'steady growth' period. To begin with, we have to get estimates of the next ten years of cash flows. Where possible we use analyst estimates, but when these aren't available we extrapolate the previous free cash flow (FCF) from the last estimate or reported value. We assume companies with shrinking free cash flow will slow their rate of shrinkage, and that companies with growing free cash flow will see their growth rate slow, over this period. We do this to reflect that growth tends to slow more in the early years than it does in later years.
Generally we assume that a dollar today is more valuable than a dollar in the future, so we discount the value of these future cash flows to their estimated value in today's dollars:
10-year free cash flow (FCF) forecast
| 2024 | 2025 | 2026 | 2027 | 2028 | 2029 | 2030 | 2031 | 2032 | 2033 | |
| Levered FCF ($, Millions) | US$220.7m | US$423.1m | US$594.6m | US$708.4m | US$811.6m | US$888.1m | US$952.7m | US$1.01b | US$1.06b | US$1.10b |
| Growth Rate Estimate Source | Analyst x9 | Analyst x10 | Analyst x7 | Analyst x3 | Analyst x3 | Est @ 9.42% | Est @ 7.28% | Est @ 5.78% | Est @ 4.73% | Est @ 4.00% |
| Present Value ($, Millions) Discounted @ 8.4% | US$204 | US$360 | US$467 | US$513 | US$542 | US$547 | US$541 | US$528 | US$510 | US$489 |
("Est" = FCF growth rate estimated by Simply Wall St)
Present Value of 10-year Cash Flow (PVCF) = US$4.7b
The second stage is also known as Terminal Value, this is the business's cash flow after the first stage. For a number of reasons a very conservative growth rate is used that cannot exceed that of a country's GDP growth. In this case we have used the 5-year average of the 10-year government bond yield (2.3%) to estimate future growth. In the same way as with the 10-year 'growth' period, we discount future cash flows to today's value, using a cost of equity of 8.4%.
Terminal Value (TV)= FCF2033 × (1 + g) ÷ (r – g) = US$1.1b× (1 + 2.3%) ÷ (8.4%– 2.3%) = US$18b
Present Value of Terminal Value (PVTV)= TV / (1 + r)10= US$18b÷ ( 1 + 8.4%)10= US$8.2b
The total value, or equity value, is then the sum of the present value of the future cash flows, which in this case is US$13b. The last step is to then divide the equity value by the number of shares outstanding. Relative to the current share price of US$58.8, the company appears quite undervalued at a 45% discount to where the stock price trades currently. The assumptions in any calculation have a big impact on the valuation, so it is better to view this as a rough estimate, not precise down to the last cent.
The Assumptions
We would point out that the most important inputs to a discounted cash flow are the discount rate and of course the actual cash flows. Part of investing is coming up with your own evaluation of a company's future performance, so try the calculation yourself and check your own assumptions. The DCF also does not consider the possible cyclicality of an industry, or a company's future capital requirements, so it does not give a full picture of a company's potential performance. Given that we are looking at Wayfair as potential shareholders, the cost of equity is used as the discount rate, rather than the cost of capital (or weighted average cost of capital, WACC) which accounts for debt. In this calculation we've used 8.4%, which is based on a levered beta of 1.332. Beta is a measure of a stock's volatility, compared to the market as a whole. We get our beta from the industry average beta of globally comparable companies, with an imposed limit between 0.8 and 2.0, which is a reasonable range for a stable business.
SWOT Analysis for Wayfair
Strength
- No major strengths identified for W.
Weakness
- Shareholders have been diluted in the past year.
Opportunity
- Forecast to reduce losses next year.
- Has sufficient cash runway for more than 3 years based on current free cash flows.
- Trading below our estimate of fair value by more than 20%.
Threat
- Debt is not well covered by operating cash flow.
- Total liabilities exceed total assets, which raises the risk of financial distress.
- Not expected to become profitable over the next 3 years.
Looking Ahead:
Valuation is only one side of the coin in terms of building your investment thesis, and it ideally won't be the sole piece of analysis you scrutinize for a company. It's not possible to obtain a foolproof valuation with a DCF model. Rather it should be seen as a guide to "what assumptions need to be true for this stock to be under/overvalued?" For instance, if the terminal value growth rate is adjusted slightly, it can dramatically alter the overall result. What is the reason for the share price sitting below the intrinsic value? For Wayfair, we've put together three important items you should look at:
- Risks: For example, we've discovered 4 warning signs for Wayfair (1 is concerning!) that you should be aware of before investing here.
- Future Earnings: How does W's growth rate compare to its peers and the wider market? Dig deeper into the analyst consensus number for the upcoming years by interacting with our free analyst growth expectation chart.
- Other Solid Businesses: Low debt, high returns on equity and good past performance are fundamental to a strong business. Why not explore our interactive list of stocks with solid business fundamentals to see if there are other companies you may not have considered!
PS. The Simply Wall St app conducts a discounted cash flow valuation for every stock on the NYSE every day. If you want to find the calculation for other stocks just search here.
Valuation is complex, but we're here to simplify it.
Discover if Wayfair might be undervalued or overvalued with our detailed analysis, featuring fair value estimates, potential risks, dividends, insider trades, and its financial condition.
Access Free AnalysisHave feedback on this article? Concerned about the content? Get in touch with us directly. Alternatively, email editorial-team (at) simplywallst.com.
This article by Simply Wall St is general in nature. We provide commentary based on historical data and analyst forecasts only using an unbiased methodology and our articles are not intended to be financial advice. It does not constitute a recommendation to buy or sell any stock, and does not take account of your objectives, or your financial situation. We aim to bring you long-term focused analysis driven by fundamental data. Note that our analysis may not factor in the latest price-sensitive company announcements or qualitative material. Simply Wall St has no position in any stocks mentioned.
About NYSE:W
Wayfair
Engages in the e-commerce business in the United States and internationally.
Undervalued low.
Similar Companies
Market Insights

Advertisement
Community Narratives
SSAB in pole position when it comes to the combination of steel tariffs and the EU's investment drive
Fair Value SEK 86.87|32.1% undervalued
PI
Community Contributor
The Future of Lennar and Homebuilding Faces Short Term Challenges with Potential for Long Term Growth
Fair Value US$162.49|34.7% undervalued
ZE
Community Contributor
Saudi Aramco (SASE:2222): Not The Sexiest High Dividend Yield Stock, But One With Interesting 'Convertible-Like' Qualities
Fair Value ر.س37.02|29.9% undervalued
EV
Community Contributor