- United States
- /
- Chemicals
- /
- NYSE:IFF
Calculating The Intrinsic Value Of International Flavors & Fragrances Inc. (NYSE:IFF)


Key Insights
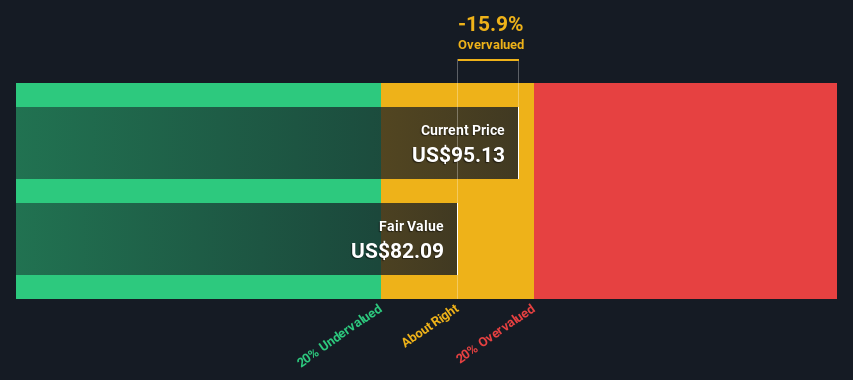
- Using the 2 Stage Free Cash Flow to Equity, International Flavors & Fragrances fair value estimate is US$82.09
- With US$95.13 share price, International Flavors & Fragrances appears to be trading close to its estimated fair value
- Analyst price target for IFF is US$96.46, which is 18% above our fair value estimate
Does the May share price for International Flavors & Fragrances Inc. (NYSE:IFF) reflect what it's really worth? Today, we will estimate the stock's intrinsic value by taking the expected future cash flows and discounting them to their present value. We will take advantage of the Discounted Cash Flow (DCF) model for this purpose. Before you think you won't be able to understand it, just read on! It's actually much less complex than you'd imagine.
Remember though, that there are many ways to estimate a company's value, and a DCF is just one method. For those who are keen learners of equity analysis, the Simply Wall St analysis model here may be something of interest to you.
View our latest analysis for International Flavors & Fragrances
The Method
We are going to use a two-stage DCF model, which, as the name states, takes into account two stages of growth. The first stage is generally a higher growth period which levels off heading towards the terminal value, captured in the second 'steady growth' period. In the first stage we need to estimate the cash flows to the business over the next ten years. Where possible we use analyst estimates, but when these aren't available we extrapolate the previous free cash flow (FCF) from the last estimate or reported value. We assume companies with shrinking free cash flow will slow their rate of shrinkage, and that companies with growing free cash flow will see their growth rate slow, over this period. We do this to reflect that growth tends to slow more in the early years than it does in later years.
A DCF is all about the idea that a dollar in the future is less valuable than a dollar today, so we discount the value of these future cash flows to their estimated value in today's dollars:
10-year free cash flow (FCF) forecast
| 2024 | 2025 | 2026 | 2027 | 2028 | 2029 | 2030 | 2031 | 2032 | 2033 | |
| Levered FCF ($, Millions) | US$596.6m | US$930.1m | US$1.14b | US$1.29b | US$1.31b | US$1.34b | US$1.36b | US$1.39b | US$1.42b | US$1.45b |
| Growth Rate Estimate Source | Analyst x6 | Analyst x6 | Analyst x2 | Analyst x1 | Analyst x1 | Est @ 1.80% | Est @ 1.97% | Est @ 2.10% | Est @ 2.18% | Est @ 2.24% |
| Present Value ($, Millions) Discounted @ 7.8% | US$553 | US$801 | US$910 | US$956 | US$902 | US$852 | US$806 | US$764 | US$724 | US$687 |
("Est" = FCF growth rate estimated by Simply Wall St)
Present Value of 10-year Cash Flow (PVCF) = US$8.0b
We now need to calculate the Terminal Value, which accounts for all the future cash flows after this ten year period. The Gordon Growth formula is used to calculate Terminal Value at a future annual growth rate equal to the 5-year average of the 10-year government bond yield of 2.4%. We discount the terminal cash flows to today's value at a cost of equity of 7.8%.
Terminal Value (TV)= FCF2033 × (1 + g) ÷ (r – g) = US$1.5b× (1 + 2.4%) ÷ (7.8%– 2.4%) = US$28b
Present Value of Terminal Value (PVTV)= TV / (1 + r)10= US$28b÷ ( 1 + 7.8%)10= US$13b
The total value, or equity value, is then the sum of the present value of the future cash flows, which in this case is US$21b. To get the intrinsic value per share, we divide this by the total number of shares outstanding. Relative to the current share price of US$95.1, the company appears around fair value at the time of writing. Valuations are imprecise instruments though, rather like a telescope - move a few degrees and end up in a different galaxy. Do keep this in mind.
Important Assumptions
The calculation above is very dependent on two assumptions. The first is the discount rate and the other is the cash flows. Part of investing is coming up with your own evaluation of a company's future performance, so try the calculation yourself and check your own assumptions. The DCF also does not consider the possible cyclicality of an industry, or a company's future capital requirements, so it does not give a full picture of a company's potential performance. Given that we are looking at International Flavors & Fragrances as potential shareholders, the cost of equity is used as the discount rate, rather than the cost of capital (or weighted average cost of capital, WACC) which accounts for debt. In this calculation we've used 7.8%, which is based on a levered beta of 1.175. Beta is a measure of a stock's volatility, compared to the market as a whole. We get our beta from the industry average beta of globally comparable companies, with an imposed limit between 0.8 and 2.0, which is a reasonable range for a stable business.
SWOT Analysis for International Flavors & Fragrances
- No major strengths identified for IFF.
- Interest payments on debt are not well covered.
- Dividend is low compared to the top 25% of dividend payers in the Chemicals market.
- Expensive based on P/S ratio and estimated fair value.
- Expected to breakeven next year.
- Has sufficient cash runway for more than 3 years based on current free cash flows.
- Debt is not well covered by operating cash flow.
- Paying a dividend but company is unprofitable.
Next Steps:
Valuation is only one side of the coin in terms of building your investment thesis, and it shouldn't be the only metric you look at when researching a company. The DCF model is not a perfect stock valuation tool. Preferably you'd apply different cases and assumptions and see how they would impact the company's valuation. For instance, if the terminal value growth rate is adjusted slightly, it can dramatically alter the overall result. For International Flavors & Fragrances, we've compiled three further elements you should look at:
- Risks: You should be aware of the 2 warning signs for International Flavors & Fragrances (1 is a bit concerning!) we've uncovered before considering an investment in the company.
- Future Earnings: How does IFF's growth rate compare to its peers and the wider market? Dig deeper into the analyst consensus number for the upcoming years by interacting with our free analyst growth expectation chart.
- Other High Quality Alternatives: Do you like a good all-rounder? Explore our interactive list of high quality stocks to get an idea of what else is out there you may be missing!
PS. The Simply Wall St app conducts a discounted cash flow valuation for every stock on the NYSE every day. If you want to find the calculation for other stocks just search here.
If you're looking to trade International Flavors & Fragrances, open an account with the lowest-cost platform trusted by professionals, Interactive Brokers.
With clients in over 200 countries and territories, and access to 160 markets, IBKR lets you trade stocks, options, futures, forex, bonds and funds from a single integrated account.
Enjoy no hidden fees, no account minimums, and FX conversion rates as low as 0.03%, far better than what most brokers offer.
Sponsored ContentNew: AI Stock Screener & Alerts
Our new AI Stock Screener scans the market every day to uncover opportunities.
• Dividend Powerhouses (3%+ Yield)
• Undervalued Small Caps with Insider Buying
• High growth Tech and AI Companies
Or build your own from over 50 metrics.
Have feedback on this article? Concerned about the content? Get in touch with us directly. Alternatively, email editorial-team (at) simplywallst.com.
This article by Simply Wall St is general in nature. We provide commentary based on historical data and analyst forecasts only using an unbiased methodology and our articles are not intended to be financial advice. It does not constitute a recommendation to buy or sell any stock, and does not take account of your objectives, or your financial situation. We aim to bring you long-term focused analysis driven by fundamental data. Note that our analysis may not factor in the latest price-sensitive company announcements or qualitative material. Simply Wall St has no position in any stocks mentioned.
About NYSE:IFF
International Flavors & Fragrances
Manufactures and markets food, beverage, health and biosciences, scent, pharma solutions, and complementary adjacent products in the United States, Europe, and internationally.
Moderate growth potential second-rate dividend payer.
Similar Companies
Market Insights

Community Narratives
