- United States
- /
- Metals and Mining
- /
- NYSE:FCX
Estimating The Fair Value Of Freeport-McMoRan Inc. (NYSE:FCX)


Key Insights
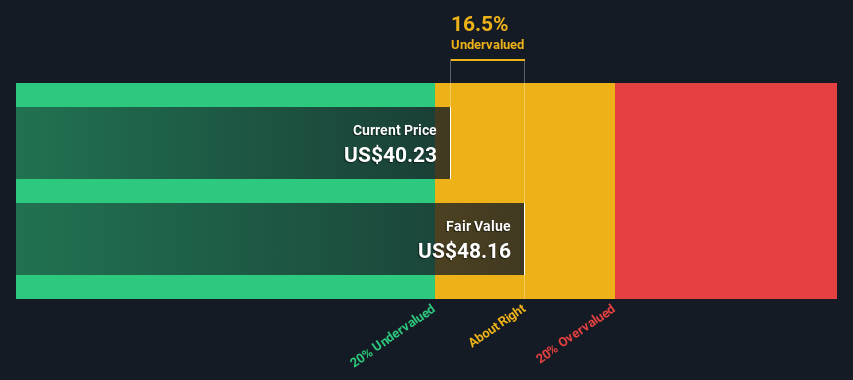
- Freeport-McMoRan's estimated fair value is US$48.16 based on 2 Stage Free Cash Flow to Equity
- With US$40.23 share price, Freeport-McMoRan appears to be trading close to its estimated fair value
- Our fair value estimate is 4.0% higher than Freeport-McMoRan's analyst price target of US$46.30
Today we will run through one way of estimating the intrinsic value of Freeport-McMoRan Inc. (NYSE:FCX) by taking the expected future cash flows and discounting them to today's value. We will use the Discounted Cash Flow (DCF) model on this occasion. Believe it or not, it's not too difficult to follow, as you'll see from our example!
Companies can be valued in a lot of ways, so we would point out that a DCF is not perfect for every situation. If you still have some burning questions about this type of valuation, take a look at the Simply Wall St analysis model.
See our latest analysis for Freeport-McMoRan
Crunching The Numbers
We are going to use a two-stage DCF model, which, as the name states, takes into account two stages of growth. The first stage is generally a higher growth period which levels off heading towards the terminal value, captured in the second 'steady growth' period. To begin with, we have to get estimates of the next ten years of cash flows. Where possible we use analyst estimates, but when these aren't available we extrapolate the previous free cash flow (FCF) from the last estimate or reported value. We assume companies with shrinking free cash flow will slow their rate of shrinkage, and that companies with growing free cash flow will see their growth rate slow, over this period. We do this to reflect that growth tends to slow more in the early years than it does in later years.
Generally we assume that a dollar today is more valuable than a dollar in the future, so we discount the value of these future cash flows to their estimated value in today's dollars:
10-year free cash flow (FCF) estimate
| 2024 | 2025 | 2026 | 2027 | 2028 | 2029 | 2030 | 2031 | 2032 | 2033 | |
| Levered FCF ($, Millions) | US$3.02b | US$5.29b | US$4.87b | US$3.95b | US$5.01b | US$4.91b | US$4.87b | US$4.88b | US$4.92b | US$4.98b |
| Growth Rate Estimate Source | Analyst x4 | Analyst x5 | Analyst x3 | Analyst x2 | Analyst x1 | Est @ -1.95% | Est @ -0.70% | Est @ 0.18% | Est @ 0.79% | Est @ 1.22% |
| Present Value ($, Millions) Discounted @ 8.2% | US$2.8k | US$4.5k | US$3.8k | US$2.9k | US$3.4k | US$3.1k | US$2.8k | US$2.6k | US$2.4k | US$2.3k |
("Est" = FCF growth rate estimated by Simply Wall St)
Present Value of 10-year Cash Flow (PVCF) = US$31b
After calculating the present value of future cash flows in the initial 10-year period, we need to calculate the Terminal Value, which accounts for all future cash flows beyond the first stage. For a number of reasons a very conservative growth rate is used that cannot exceed that of a country's GDP growth. In this case we have used the 5-year average of the 10-year government bond yield (2.2%) to estimate future growth. In the same way as with the 10-year 'growth' period, we discount future cash flows to today's value, using a cost of equity of 8.2%.
Terminal Value (TV)= FCF2033 × (1 + g) ÷ (r – g) = US$5.0b× (1 + 2.2%) ÷ (8.2%– 2.2%) = US$85b
Present Value of Terminal Value (PVTV)= TV / (1 + r)10= US$85b÷ ( 1 + 8.2%)10= US$39b
The total value is the sum of cash flows for the next ten years plus the discounted terminal value, which results in the Total Equity Value, which in this case is US$69b. In the final step we divide the equity value by the number of shares outstanding. Compared to the current share price of US$40.2, the company appears about fair value at a 16% discount to where the stock price trades currently. The assumptions in any calculation have a big impact on the valuation, so it is better to view this as a rough estimate, not precise down to the last cent.
Important Assumptions
Now the most important inputs to a discounted cash flow are the discount rate, and of course, the actual cash flows. Part of investing is coming up with your own evaluation of a company's future performance, so try the calculation yourself and check your own assumptions. The DCF also does not consider the possible cyclicality of an industry, or a company's future capital requirements, so it does not give a full picture of a company's potential performance. Given that we are looking at Freeport-McMoRan as potential shareholders, the cost of equity is used as the discount rate, rather than the cost of capital (or weighted average cost of capital, WACC) which accounts for debt. In this calculation we've used 8.2%, which is based on a levered beta of 1.200. Beta is a measure of a stock's volatility, compared to the market as a whole. We get our beta from the industry average beta of globally comparable companies, with an imposed limit between 0.8 and 2.0, which is a reasonable range for a stable business.
SWOT Analysis for Freeport-McMoRan
- Debt is not viewed as a risk.
- Earnings declined over the past year.
- Dividend is low compared to the top 25% of dividend payers in the Metals and Mining market.
- Annual earnings are forecast to grow faster than the American market.
- Current share price is below our estimate of fair value.
- Dividends are not covered by cash flow.
- Annual revenue is forecast to grow slower than the American market.
Looking Ahead:
Although the valuation of a company is important, it ideally won't be the sole piece of analysis you scrutinize for a company. DCF models are not the be-all and end-all of investment valuation. Rather it should be seen as a guide to "what assumptions need to be true for this stock to be under/overvalued?" For instance, if the terminal value growth rate is adjusted slightly, it can dramatically alter the overall result. For Freeport-McMoRan, there are three further factors you should consider:
- Risks: For instance, we've identified 1 warning sign for Freeport-McMoRan that you should be aware of.
- Future Earnings: How does FCX's growth rate compare to its peers and the wider market? Dig deeper into the analyst consensus number for the upcoming years by interacting with our free analyst growth expectation chart.
- Other Solid Businesses: Low debt, high returns on equity and good past performance are fundamental to a strong business. Why not explore our interactive list of stocks with solid business fundamentals to see if there are other companies you may not have considered!
PS. The Simply Wall St app conducts a discounted cash flow valuation for every stock on the NYSE every day. If you want to find the calculation for other stocks just search here.
New: AI Stock Screener & Alerts
Our new AI Stock Screener scans the market every day to uncover opportunities.
• Dividend Powerhouses (3%+ Yield)
• Undervalued Small Caps with Insider Buying
• High growth Tech and AI Companies
Or build your own from over 50 metrics.
Have feedback on this article? Concerned about the content? Get in touch with us directly. Alternatively, email editorial-team (at) simplywallst.com.
This article by Simply Wall St is general in nature. We provide commentary based on historical data and analyst forecasts only using an unbiased methodology and our articles are not intended to be financial advice. It does not constitute a recommendation to buy or sell any stock, and does not take account of your objectives, or your financial situation. We aim to bring you long-term focused analysis driven by fundamental data. Note that our analysis may not factor in the latest price-sensitive company announcements or qualitative material. Simply Wall St has no position in any stocks mentioned.
About NYSE:FCX
Freeport-McMoRan
Engages in the mining of mineral properties in North America, South America, and Indonesia.
Excellent balance sheet second-rate dividend payer.
