
Quote of the Week: “The intrinsic value of an asset is determined by the cash flows you expect that asset to generate over its life and how uncertain you feel about these cash flows.” ― Aswath Damodaran
Earnings season is underway, which means analysts will probably be adjusting their earnings estimates and price targets over the next few months. As it stands, there’s a big difference between the 12-month price targets for US and non-US stocks - so it will be interesting to see if reality starts to support that view.
We’ve received a few questions about the fair value estimates you see on the platform, and the earnings estimates and price targets - and where we get all the data. So we thought this newsletter would be a good opportunity to explain the sources and the methodology behind the numbers you see on Simply Wall St company reports.
Let’s dive in!
🎧 Would you prefer to listen to these insights? You can find the audio version on our Spotify, Apple Podcasts or YouTube!
What Happened in Markets this Week?
Here’s a quick summary of what’s been going on:
-
📱TikTok plans to shut down operations in the US on Sunday ( Reuters )
- What’s our take?
- Could this be an end to doom-scrolling?
- The looming Sunday ban, if enforced, would remove TikTok from app stores and block essential services for U.S. operations, impacting the 170 million Americans that use the app.
- The ban comes into effect after a law signed off on in April mandated a ban on new TikTok downloads on Apple’s or Google’s app stores if TikTok’s Chinese parent ByteDance fails to divest the site.
- Despite talk of an executive order or Supreme Court intervention, it’s unclear whether President-elect Donald Trump (who’s taking office on Monday) or President Joe Biden can realistically halt the ban in time.
- TikTok has prepared for a complete U.S. shutdown to protect itself and its U.S. partners from legal liability, though the company says it could quickly restore services if a ban is overturned or extended.
-
🎮 Nintendo shares a first look at the all new Switch 2 console ( Verge )
- What’s our take?
- It’s a winning formula, but is it too safe?
- Entertainment giant Nintendo revealed a first look of its next-gen console. The Switch 2 is a successor to the successful Nintendo Switch, which is the 3rd best-selling video game console of all time and the biggest seller released in the last 20 years.
- Nintendo usually brings about radical change in their consoles with each generation, but the upcoming Switch 2 seems to be only an incremental change on the design of its predecessor.
- Backward compatibility with the original Switch library of games is undoubtedly a move to safeguard Nintendo’s massive existing user base, though Nintendo warns that some titles may not fully function on the new console.
- Nintendo has been quite tight-lipped about the release timeline, but a dedicated Direct in April to dive further into the console could hint at a mid-year 2025 release.
-
🚀 Jeff Bezos’ Blue Origin fires back at Elon Musk as the billionaire space race heats up ( FT )
- What’s our take?
- One small step for man, one giant leap for billionaire kind.
- Blue Origin’s successful orbital debut of its New Glenn rocket, albeit five years behind schedule, marks a serious bid to challenge SpaceX’s dominance in the satellite launch market.
- As with SpaceX, component re-usability remains a key cost driver of the project. While the booster’s return failed this time, proving it can be reused is a crucial step towards matching (and potentially undercutting) SpaceX on pricing.
- The link between New Glenn and Amazon’s Kuiper satellite project could help ensure Blue Origin hits the ground running in the broadband-from-space market, though SpaceX and Starlink still leads considerably.
- Blue Origin’s competitor SpaceX’s just launched the 7th test flight of its Starship mega-rocket. The launch proved a partial success, with a booster successfully returning, but the upper stage spacecraft (the part actually known as Starship) was lost.
-
🛢️ BP to cut up to 5% of its workforce in the latest cost-cutting measures ( Bloomberg )
- What’s our take?
- BP’s announcement of 4,700 internal job cuts and over 3,000 contractor positions is a move to reduce costs and try to restore investor confidence, after the company’s recent underperformance.
- The company’s pivot back toward traditional oil and gas, after previously overcommitting to low-carbon ventures, could be seen as an appeasement move for shareholders as BP tries to stabilise revenue streams.
- CEO, Murray Auchincloss, mentioned that a renewed emphasis on digitisation, including AI deployments, and the halting of 30 less-profitable projects is key to BP’s plans to hit its $2 billion cost reduction target by 2026.
-
📱 Apple takes a hit in the Chinese market as local manufacturers favoured ( Reuters )
- What’s our take?
- Much like the EV market, China has taken the fight to the US.
- Local manufacturers, Vivo and Huawei, overtook Apple in China’s smartphone market in 2024, driven by patriotic buying, aggressive marketing, and AI-powered features—which are currently unavailable on iPhones within mainland China.
- Apple’s China shipments fell by 17% in 2024, causing the US tech giant to drop to 3rd in market share. The changing tides reflect a growing pressure from domestic brands that are able to roll out more advanced and locally tailored devices.
- A new government subsidy program could slightly boost overall smartphone sales, but analysts say Apple’s higher-end offerings may benefit less and remain challenged by stringent Chinese AI regulations.
-
💰 Millions of borrowers could have their student loan payment obligations suspended until later in 2025 ( Forbes )
- What’s our take?
- Millions of borrowers may not have any student loan payments until at least December 2025, thanks to a legal blockade on the SAVE plan and other IDR programs, which will keep them in a forbearance period without interest accruing.
- Borrowers should be aware that this forbearance time won’t count toward IDR or Public Service Loan Forgiveness (PSLF) progress, forcing borrowers to switch to a different qualifying repayment plan (like IBR) if they wish to continue earning credit towards student loan forgiveness.
- The Education Department’s timeline for returning borrowers to repayment in late 2025 could shift again, given the looming Trump administration transition and potential congressional action, which adds more uncertainty to an already turbulent situation.
⚖️ Comparing 2025 Price Targets For The S&P 500 And MSCI World Index
Market pundits are generally quite optimistic about the US economy in 2025, but some estimates suggest non-US shares could outperform by quite a large margin.
For the S&P 500 index, Factset has a bottom up target level of 6,755 for year-end. That’s 13% higher than the index level at the end of 2024. A bottom up target is calculated using the consensus targets for all the companies in the index.
Top down targets from Wall Street’s strategy teams average 6,600 implying a slightly lower return. Most of the estimates are between 6,500 and 6700, with one as low as 5,000 , and a select few just above 7,000.
For the MSCI ACWI (all country world index) there’s less consensus. Analysts at Citi expect a 10% gain for the index. However, the consensus EPS estimate is $47, which at the current P/E of 22x would imply a 22% return.
The TipRanks website has an even more bullish target, which implies a 33% target! That estimate needs a lot of context though. It’s a bottom up estimate based on target prices for all 2,647 underlying companies. That means there are thousands of underlying estimates, and some may be more reliable than others.
Still, when you consider that 66% of the MSCI index is made up of US companies, the remaining international companies would have to do a lot of heavy lifting.
🎯 How To Use Analyst Estimates And Price Targets
Simply Wall St’s company reports provide a wealth of valuable data to assist you in making investment decisions. This data is sourced from S&P Global Market Intelligence, one of the largest financial data providers in the world.
You can read more about the platform's data here.
The data S&P provides is sourced from regulatory filings, stock exchanges, company websites, and news agencies. S&P also collects estimates for future earnings, revenue and 12-month price targets from analysts working at independent research firms, investment banks, and brokers.
Before we look at the estimates on the company reports, it’s worth having a look at the securities research industry that produces those estimates.
🏦 How Wall Street Works
The term Wall Street is used to describe all the companies that make up the financial markets industry in New York. But markets are now so interconnected that the term could easily be used to describe financial markets companies across the US and even around the world.
Wall Street includes companies that provide services to institutions and retail investors. Analysts working at 'Sell-Side' firms typically publish the forecasts and estimates you see in the media, and on the Simply Wall St platform. These are the companies that provide research and trading services to ‘Buy-Side’ firms that manage money on behalf of clients.
💼 The Buy-Side
The companies that buy research and trading services include institutions like insurance companies, pension funds and endowments and asset management companies, which include hedge funds and investment advisors. Institutions can manage money internally, or outsource management to asset managers. Often they do a bit of both.
Buy-side firms employ portfolio managers, analysts and dealers, who work as a team to manage segregated accounts, mutual funds and other investment vehicles.
💹 The Sell-Side
Sell-side firms employ analysts, strategists, economists, and sales traders. They provide research at the macro, sector and industry level, and on individual companies to buy side firms. They also provide a range of trading services to the buy-side.
🔗 The Relationship Between Buy and Sell-Side Analysts
If fund managers have their own analysts, you might be wondering why they use research from sell-side analysts. And, do they simply aggregate forecasts from the sell-side, while giving more weight to analysts with the best track records?
Buy-side analysts typically build their own models, but they use the services of sell-side analysts in two important ways:
- Firstly, sell-side analysts provide corporate access to portfolio managers and analysts. They organise company visits and conference calls to help buy-side analysts understand a company.
- And secondly, they provide buy-side analysts with a range of viewpoints and scenarios. When a sell-side analyst revises their forecast, they often speak directly to their clients and explain the thinking behind their revision. Fund managers use these discussions to develop a range of scenarios, and to assign probabilities and understand the risks to each outcome.
🤔 Factors That Affect Analyst Estimates
Buy-side research is strictly in-house and confidential. On the other hand, sell-side research and forecasts are a means of marketing the services of the firms that provide the research.
Making a big call and getting it right is the way sell side analysts can make a name for themselves and build their client base. But there are a few realities that influence their forecasts and recommendations:
- Career risk and herding: For analysts, making a contrarian call and getting it right is the best outcome. But the opposite - being wrong and alone - is also the worst outcome. Often it’s safest to be somewhere in the middle of the range unless you have really strong conviction about being contrarian.
- Corporate access: Analysts are often reluctant to be critical about a company so they don’t lose their access to senior executives.
- Investment banking relationships: Investment banks often have a securities division covering a company, and an investment banking division providing services to the same company. Negative coverage from an analyst can jeopardise the IB relationship, which makes it hard to be completely objective.
🆚 Fair-Value Estimates vs Price Targets
Now that we’ve looked at where analyst forecasts come from, we can look at how they fit into the fair value estimates and price targets you see on the platform. We will use Adobe's company report as an example and specifically the valuation section.
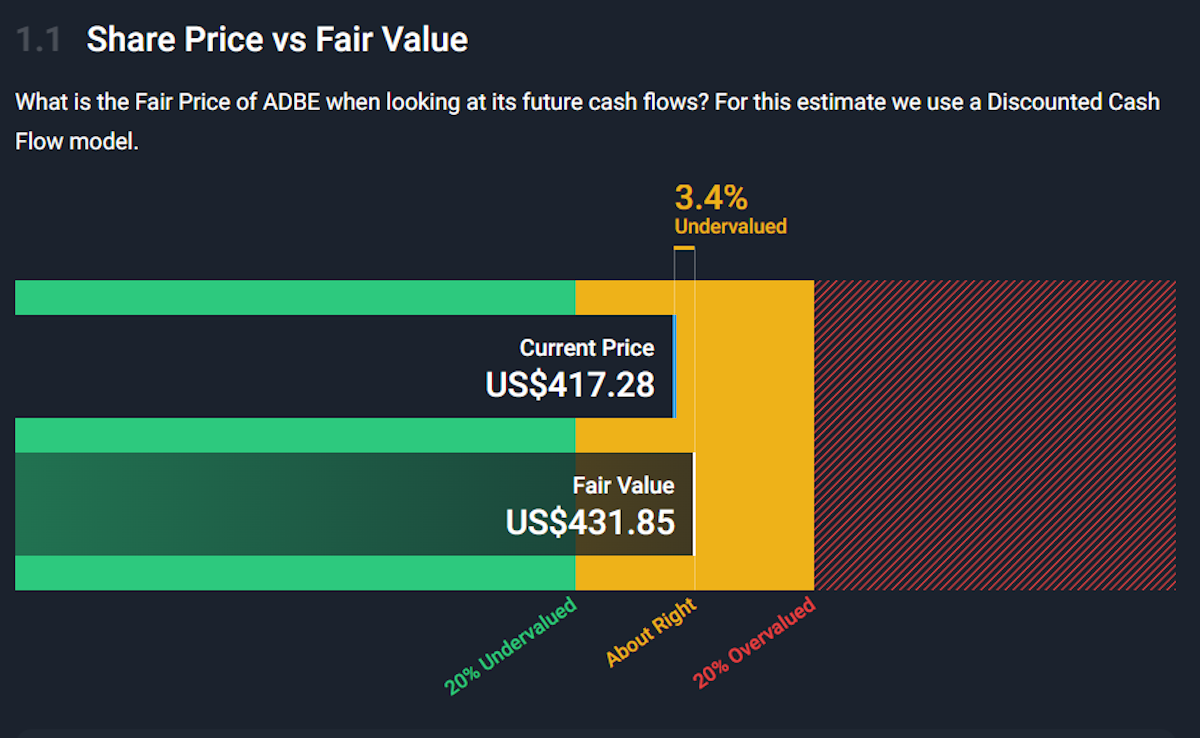
Section 1.1 reflects Adobe's fair value estimate…
…while section 1.7 shows you the consensus 12-month price target for Adobe…
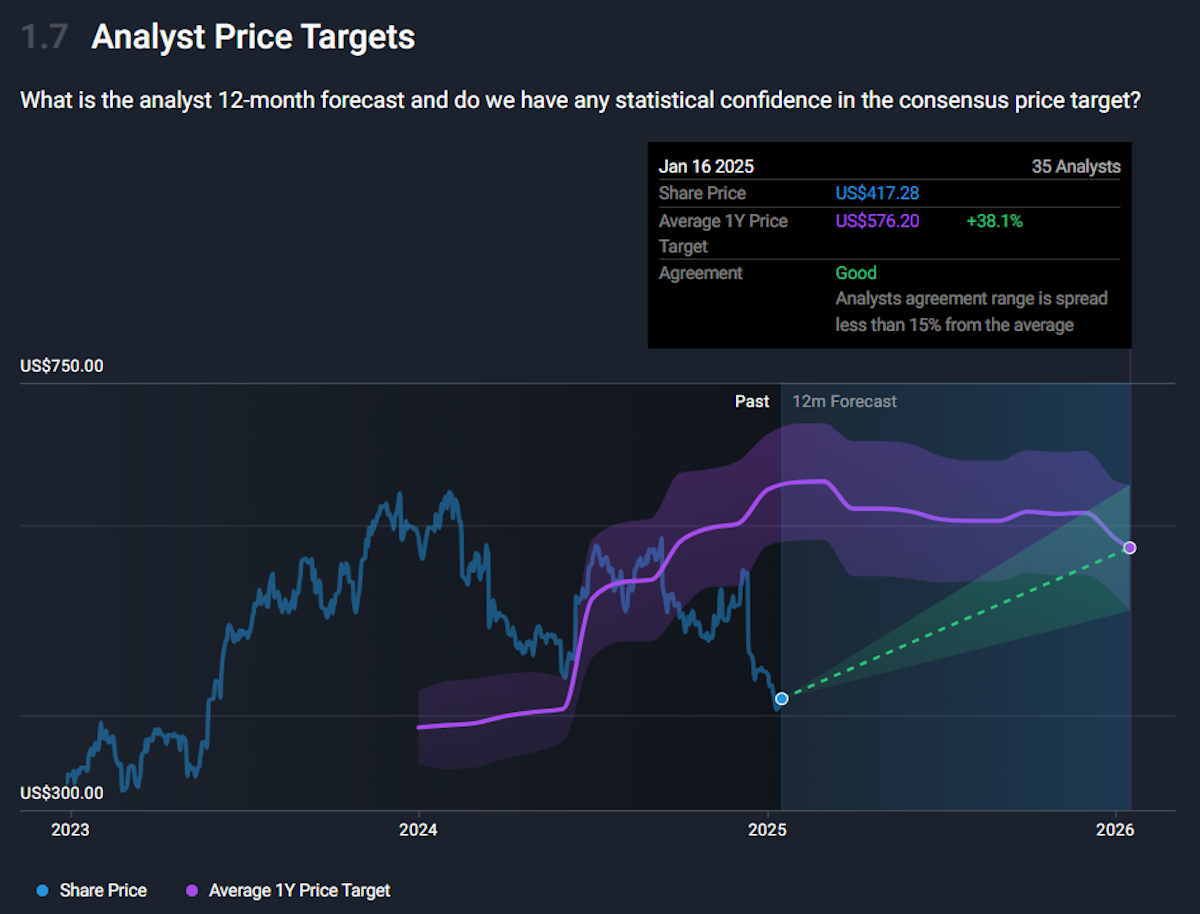
As you can see, there’s a big difference between the two, with the fair value estimate at $430 and the target price (in 12 months time) at $576.
Let’s see what both numbers represent:
📈 Fair Value
It’s important to emphasise that this number is an estimate of fair value, based on certain assumptions.
The fair value, or intrinsic value, of a business considers value from the perspective of a business owner. This is the same way you might value a private business, where your return would come from profits alone. You would be asking yourself whether you would be better off buying the business at a certain price, or putting that money in the bank, or a low-risk bond.
However, a business comes with higher risk than a bank account or bond, so you also want to be compensated for the risk. So your hurdle is the long term interest rate plus a risk premium. This is the discount rate.
✨ Fair value is the present value of all the cash flows you expect to earn in the future. And to calculate the present value, you discount future cash flows at your hurdle rate, hence the term discount rate. So your fair value estimate is really the maximum amount you can pay and still earn that discount rate.
Of course, this all depends on how accurate your estimate of future cash flows is. And this is where the other assumptions come in. The first assumption is the discount rate, while the others concern future cash flow estimates.
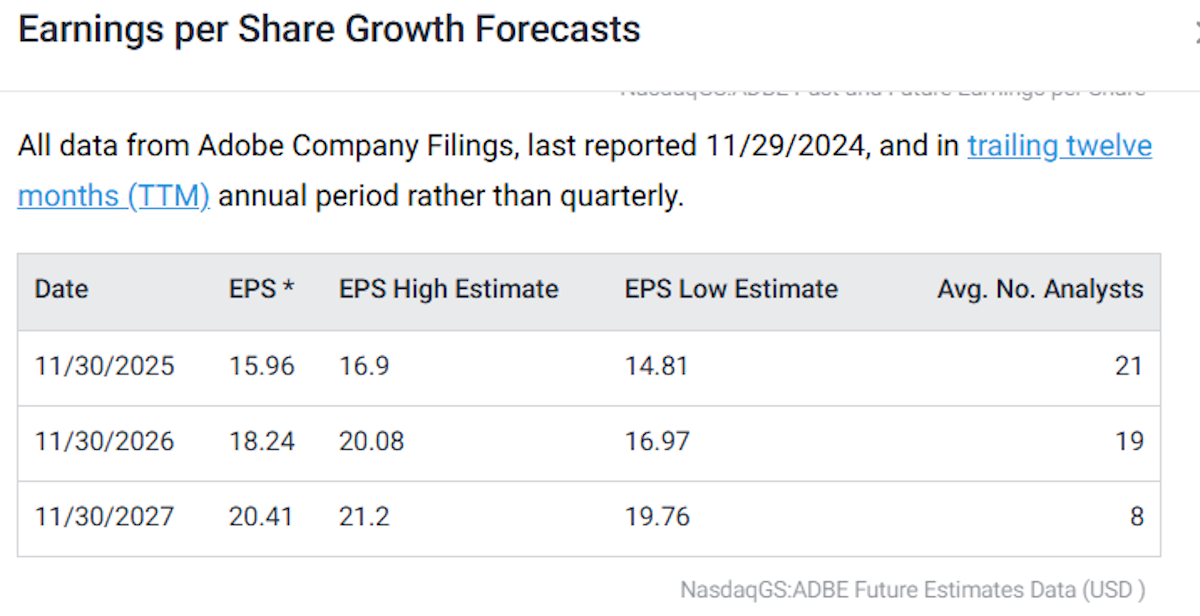
Coming back to Adobe, you can see that there are 21 estimates for EPS in 2025, 19 in 2026 and just 8 in 2027. Most analysts only publish estimates for the next 2 or 3 years.
The DCF (discount cash flow) model most commonly used to estimate fair value is based on 10 years of cash flow, and a terminal value which approximates the present value of cash flows over the following 10 years.
❗ Note: This is a very simplistic explanation of the calculation - you can read a more detailed explanation, and about other models used to estimate intrinsic value here.
To estimate cash flow over the first 10 years, we need to estimate:
- The initial growth rate: this is estimated using the average estimates for earnings, EPS, or cash flow for the next few years,
- How long growth will remain at that level: This is usually 3 to 5 years.
- A perpetual growth rate: this is the growth rate during the second 10-year period, and is usually estimated at the long term bond yield, or the average GDP growth rate.
The growth rate between the initial growth period and the second 10-year stage is estimated by decreasing the rate each year.
There are two important points to note about intrinsic/fair value estimates:
- If you are estimating cash flows over a 10 to 20-year period, they need to be conservative. Essentially, you are estimating the minimum you expect to earn, even if you hope to earn far more.
- If you are going to base an investment decision on a fair value estimate, you must agree with the assumptions that went into that estimate.
🎯 Price Targets
When analysts set a price target (typically 12 months ahead), they are estimating EPS and the multiple of EPS (the P/E ratio) they expect the market to pay at that point.
✨ The P/E a stock trades at reflects the market’s optimism about the future, so a price target includes an EPS estimate, and an estimation of the sentiment at that point.
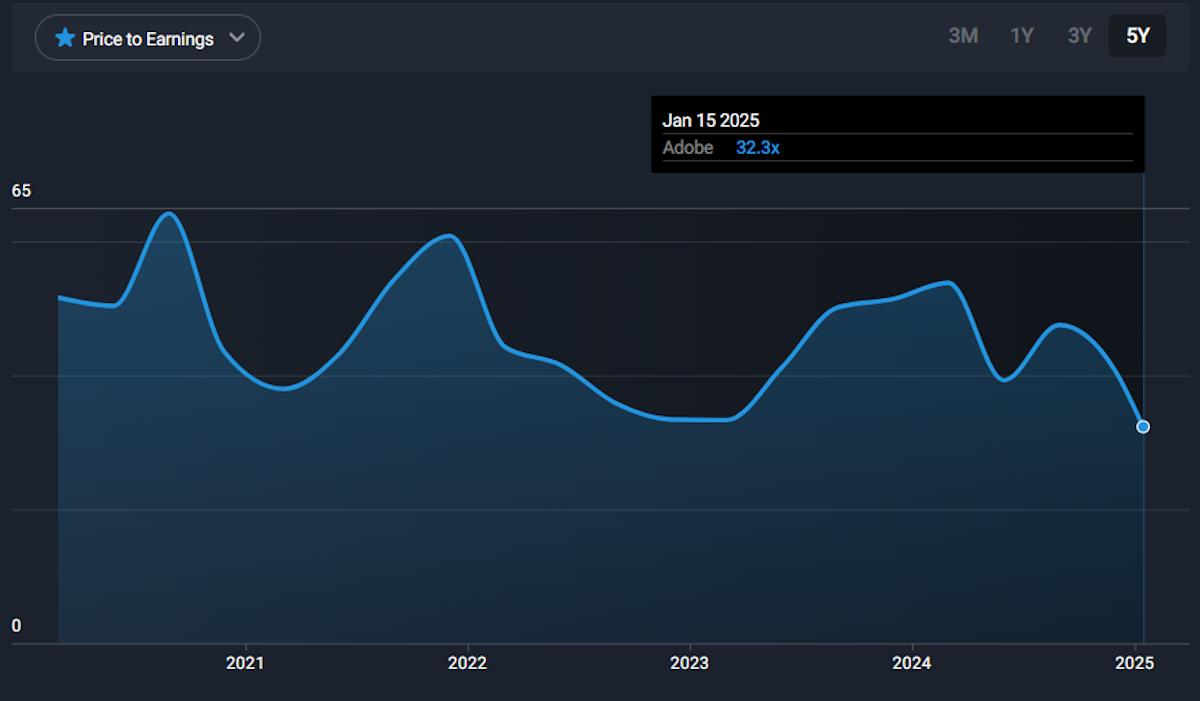
The consensus, or average, estimate for Adobe’s EPS in 2025 is $15.96. So a $576 price target implies a P/E of 36.5x. That’s a little higher than the current 33x multiple. However, looking at the 5-year range below, you can see the range can vary quite a bit. If the P/E changes a lot, the price would be very different, even if the EPS estimate turned out to be accurate.
🫧 A Lesson from the Dot Com Bubble
During the 1990s, Cisco was the market’s favourite stock. On 25th March 2000 Cisco briefly overtook Microsoft to become the most valuable company in the world. Its price peaked two days later before beginning an 88% decline, and it has yet to regain that record high.
Two weeks after the peak, an article in the WSJ explained the reality of price targets. One of the leading tech analysts during the 1990s was George Kelly at Morgan Stanley. The article quoted him as saying, "I spend a good deal of my time talking with investors these days about valuations, and it is a bit of an art. But with the stock's P/E ratio above 100, my job is to say how investors will value the stock going forward. How I feel about it isn't important.".
Kelly issued a series of buy recommendations throughout the 1990s and repeatedly set higher price targets. Between November 1999 and February 2000 he raised his target from $46, to $57 and eventually to $75 - implying a P/E of 111x forward EPS. The price topped out at $82, so he wasn’t wrong, but he didn’t change his buy recommendation until much later.
💰 The Real Value Of Analyst Forecasts
As you can see, estimates and price targets have some limitations. But they still have value if used correctly. The best way to use revenue and EPS estimates is to figure out what they imply - and whether you think that’s realistic.
The wrong way to use estimates and fair value estimates is to think of them as recommendations. The same applies to relying on an analyst’s track record. When analysts are on the right side of a trend, they will often make a series of calls that turn out to be right. But their record can quickly reverse when the underlying trend reverses.
💡 The Insight: Narrative Investing Helps You Develop Your Own Estimates
The fair value estimate and 12-month price target for Adobe give us two different perspectives on the valuation. For even more perspective, you can have a look at the four Narratives that users have published . You’ll see an even wider range of fair value estimates, with a low of $317 and a high of $898 ! More importantly, you can read about the catalysts that the authors believe back up their estimates.
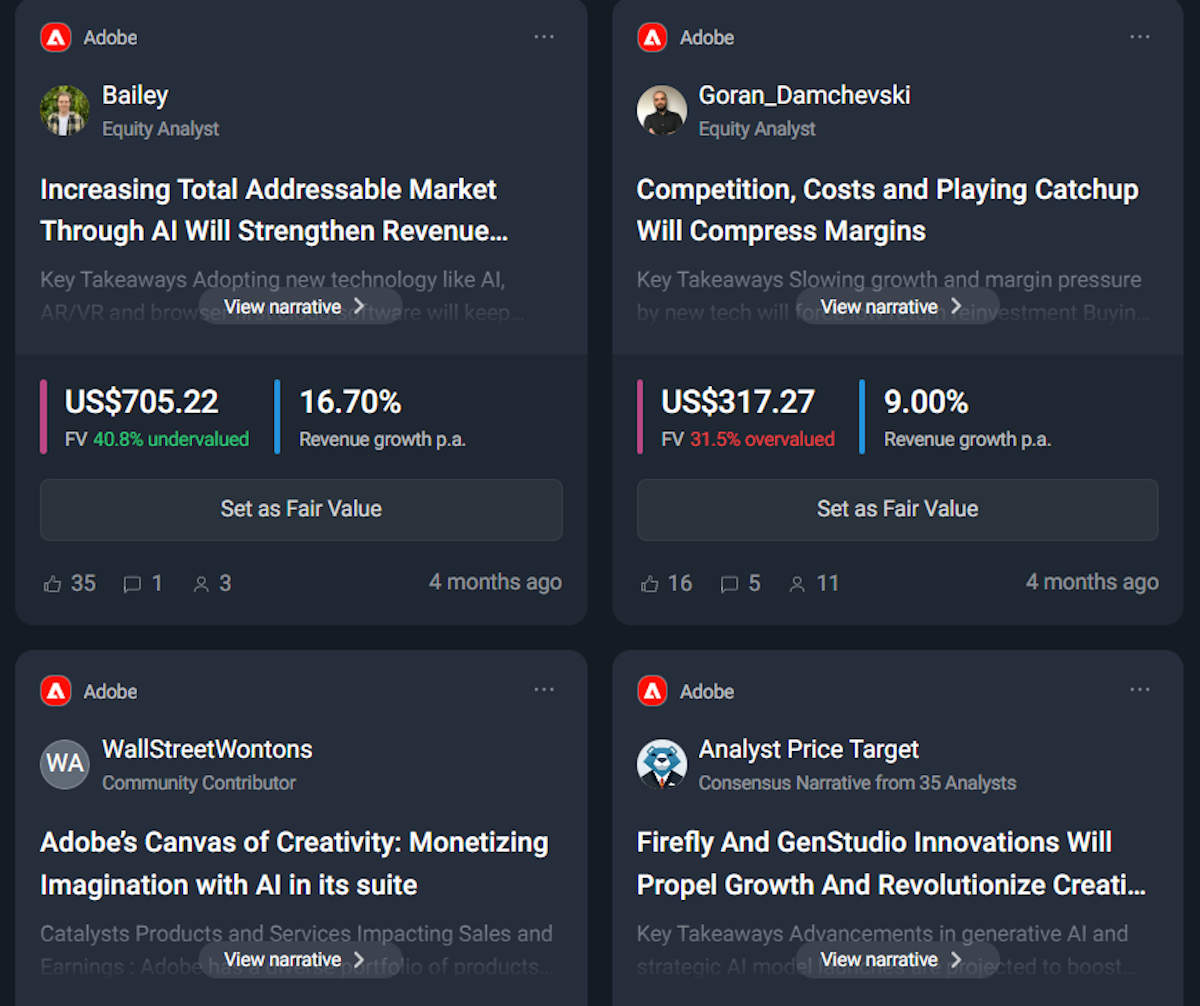
Analyst forecasts are a great starting point to develop your own narrative and fair value estimate for a company. By identifying catalysts and tying them to your own projections, you’ll arrive at a valuation that you have conviction in. And more importantly, you’ll know when things are going according to plan - or not.
Why do we use an exit P/E multiple for narrative fair value estimates ?
If you create your own narrative, you’ll notice that we use exit P/E’s to arrive at a fair value estimate. The only difference is that we discount the target share price to a present value using a discount rate. The reason for this is that the time horizon is longer (3, 5 or 10 years) which means the opportunity cost needs to be considered.
The reason we use a future P/E approach rather than a DCF, is that it provides flexibility as the narrative evolves over time. You can adjust your valuation periodically, while still thinking about the price the market is likely to pay if or when you sell. However, with a longer time horizon, it’s important to be more conservative with your P/E estimate than you might on a one-year view. That multiple can change a lot more in five years than it can in one.
❗ Note: The company reports now reflect the full range of fair value estimates from members of the community.

Key Events During The Next Week
There's little economic data this week. However, the week starts with the US inauguration, and Donald Trump is expected to enter the White House with a pile of executive orders - which could trigger some volatility.
Monday
- 🇺🇸 US market is closed.
Tuesday
- 🇬🇧 UK employment data will be published. Economists expect the unemployment rate to remain at 4.3%.
- 🇨🇦 Canada’s inflation rate is forecast to fall slightly, from 1.9% to 1.8%.
Thursday
- 🇯🇵 J apan’s trade data will be released. The previous month’s ¥117 billion deficit is expected to reverse to a ¥100 billion surplus.
- 🇺🇸 US initial jobless claims will be published. The prior number was 217K.
Friday
- 🇯🇵 Japan’s inflation rate is expected to rise from 2.9% to 3%.
- 🇯🇵 The BOJ will also announce its interest rate decision and is expected to raise the benchmark rate from 0.25% to 0.5%.
It’s the second week of earnings seasons and companies from most sectors will be reporting. The biggest names include:
- Netflix
- Charles Schwab
- HDFC
- Proctor and Gamble
- Johnson & Johnson
- Abbott Laboratories
- GE Vernova Inc.
- Intuitive Surgical
- GE Aerospace
- Texas Instruments
Have feedback on this article? Concerned about the content? Get in touch with us directly. Alternatively, email editorial-team@simplywallst.com
Simply Wall St analyst Richard Bowman and Simply Wall St have no position in any of the companies mentioned. This article is general in nature. We provide commentary based on historical data and analyst forecasts only using an unbiased methodology and our articles are not intended to be financial advice. It does not constitute a recommendation to buy or sell any stock and does not take account of your objectives, or your financial situation. We aim to bring you long-term focused analysis driven by fundamental data. Note that our analysis may not factor in the latest price-sensitive company announcements or qualitative material.

Richard Bowman
Richard is an analyst, writer and investor based in Cape Town, South Africa. He has written for several online investment publications and continues to do so. Richard is fascinated by economics, financial markets and behavioral finance. He is also passionate about tools and content that make investing accessible to everyone.


