- United States
- /
- Consumer Finance
- /
- NYSE:OMF
OneMain Holdings' (NYSE:OMF) earnings growth rate lags the 17% CAGR delivered to shareholders


If you buy and hold a stock for many years, you'd hope to be making a profit. But more than that, you probably want to see it rise more than the market average. Unfortunately for shareholders, while the OneMain Holdings, Inc. (NYSE:OMF) share price is up 22% in the last five years, that's less than the market return. However, if you include the dividends then the return is market beating. Looking at the last year alone, the stock is up 20%.
While the stock has fallen 3.8% this week, it's worth focusing on the longer term and seeing if the stocks historical returns have been driven by the underlying fundamentals.
Check out our latest analysis for OneMain Holdings
While the efficient markets hypothesis continues to be taught by some, it has been proven that markets are over-reactive dynamic systems, and investors are not always rational. One way to examine how market sentiment has changed over time is to look at the interaction between a company's share price and its earnings per share (EPS).
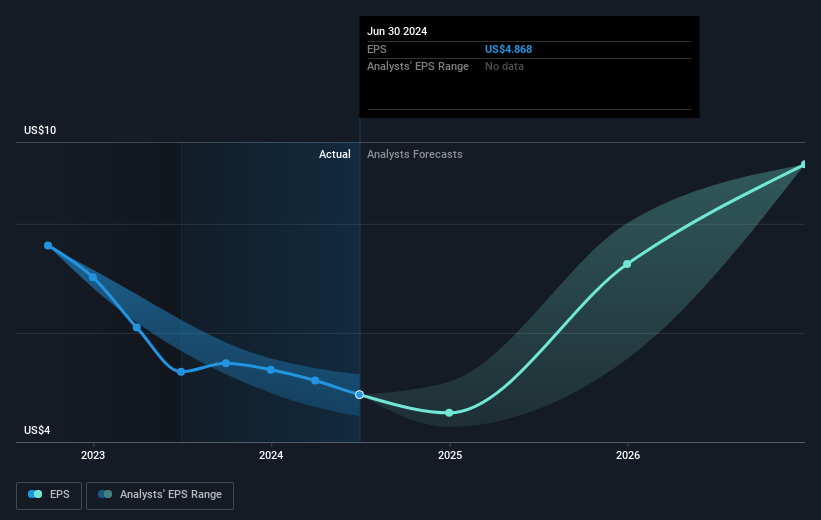
During five years of share price growth, OneMain Holdings achieved compound earnings per share (EPS) growth of 0.02% per year. This EPS growth is slower than the share price growth of 4% per year, over the same period. This suggests that market participants hold the company in higher regard, these days. That's not necessarily surprising considering the five-year track record of earnings growth.
You can see below how EPS has changed over time (discover the exact values by clicking on the image).
Before buying or selling a stock, we always recommend a close examination of historic growth trends, available here.
What About Dividends?
As well as measuring the share price return, investors should also consider the total shareholder return (TSR). The TSR incorporates the value of any spin-offs or discounted capital raisings, along with any dividends, based on the assumption that the dividends are reinvested. So for companies that pay a generous dividend, the TSR is often a lot higher than the share price return. We note that for OneMain Holdings the TSR over the last 5 years was 122%, which is better than the share price return mentioned above. And there's no prize for guessing that the dividend payments largely explain the divergence!
A Different Perspective
It's good to see that OneMain Holdings has rewarded shareholders with a total shareholder return of 31% in the last twelve months. That's including the dividend. Since the one-year TSR is better than the five-year TSR (the latter coming in at 17% per year), it would seem that the stock's performance has improved in recent times. Someone with an optimistic perspective could view the recent improvement in TSR as indicating that the business itself is getting better with time. I find it very interesting to look at share price over the long term as a proxy for business performance. But to truly gain insight, we need to consider other information, too. Even so, be aware that OneMain Holdings is showing 2 warning signs in our investment analysis , and 1 of those is significant...
If you would prefer to check out another company -- one with potentially superior financials -- then do not miss this free list of companies that have proven they can grow earnings.
Please note, the market returns quoted in this article reflect the market weighted average returns of stocks that currently trade on American exchanges.
New: AI Stock Screener & Alerts
Our new AI Stock Screener scans the market every day to uncover opportunities.
• Dividend Powerhouses (3%+ Yield)
• Undervalued Small Caps with Insider Buying
• High growth Tech and AI Companies
Or build your own from over 50 metrics.
Have feedback on this article? Concerned about the content? Get in touch with us directly. Alternatively, email editorial-team (at) simplywallst.com.
This article by Simply Wall St is general in nature. We provide commentary based on historical data and analyst forecasts only using an unbiased methodology and our articles are not intended to be financial advice. It does not constitute a recommendation to buy or sell any stock, and does not take account of your objectives, or your financial situation. We aim to bring you long-term focused analysis driven by fundamental data. Note that our analysis may not factor in the latest price-sensitive company announcements or qualitative material. Simply Wall St has no position in any stocks mentioned.
About NYSE:OMF
OneMain Holdings
A financial service holding company, engages in the consumer finance and insurance businesses in the United States.
Exceptional growth potential, good value and pays a dividend.

