- United States
- /
- Marine and Shipping
- /
- NYSE:SB
Top US Dividend Stocks For February 2025

Reviewed by Simply Wall St

As February 2025 unfolds, U.S. markets are experiencing notable turbulence, with major indices like the Dow and Nasdaq registering their steepest weekly declines in months amid broad sell-offs and economic uncertainties. In such volatile times, dividend stocks often attract attention for their potential to provide a steady income stream, serving as a buffer against market fluctuations.
Top 10 Dividend Stocks In The United States
| Name | Dividend Yield | Dividend Rating |
| Columbia Banking System (NasdaqGS:COLB) | 5.43% | ★★★★★★ |
| Interpublic Group of Companies (NYSE:IPG) | 4.88% | ★★★★★★ |
| FMC (NYSE:FMC) | 6.07% | ★★★★★★ |
| Peoples Bancorp (NasdaqGS:PEBO) | 5.03% | ★★★★★★ |
| Southside Bancshares (NYSE:SBSI) | 4.75% | ★★★★★★ |
| Dillard's (NYSE:DDS) | 5.39% | ★★★★★★ |
| Citizens & Northern (NasdaqCM:CZNC) | 5.37% | ★★★★★★ |
| Regions Financial (NYSE:RF) | 6.09% | ★★★★★★ |
| Virtus Investment Partners (NYSE:VRTS) | 4.99% | ★★★★★★ |
| First Interstate BancSystem (NasdaqGS:FIBK) | 6.05% | ★★★★★★ |
Click here to see the full list of 141 stocks from our Top US Dividend Stocks screener.
We're going to check out a few of the best picks from our screener tool.
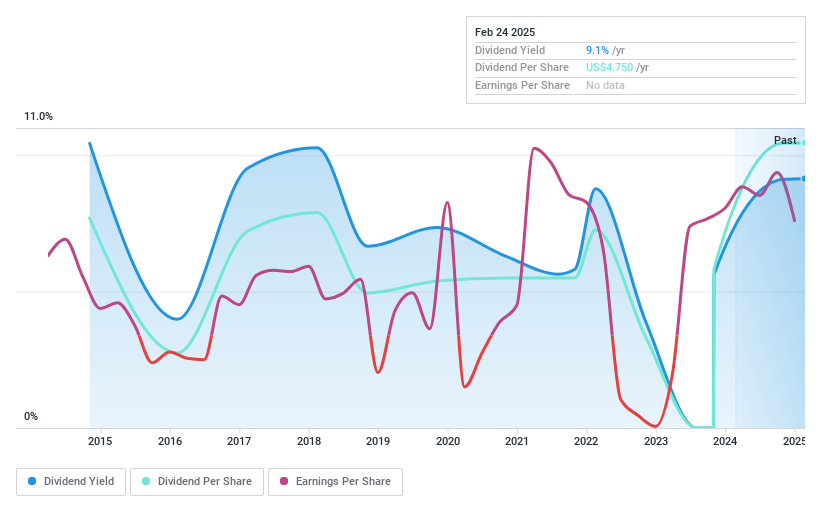
General American Investors Company (NYSE:GAM)
Simply Wall St Dividend Rating: ★★★★☆☆
Overview: General American Investors Company, Inc. is a publicly owned investment manager with a market cap of approximately $1.22 billion.
Operations: General American Investors Company, Inc. derives its revenue primarily from its Financial Services - Closed End Funds segment, which generates approximately $28.40 million.
Dividend Yield: 9.1%
General American Investors Company recently announced a special dividend of $0.25 per share from long-term capital gains, highlighting its focus on returning profits to shareholders. However, the company's dividend history is marked by volatility and unreliability over the past decade, despite a low payout ratio of 47.6% indicating coverage by earnings. The stock trades significantly below estimated fair value, but insufficient data limits insights into cash flow coverage for dividends.
- Click to explore a detailed breakdown of our findings in General American Investors Company's dividend report.
- The analysis detailed in our General American Investors Company valuation report hints at an deflated share price compared to its estimated value.
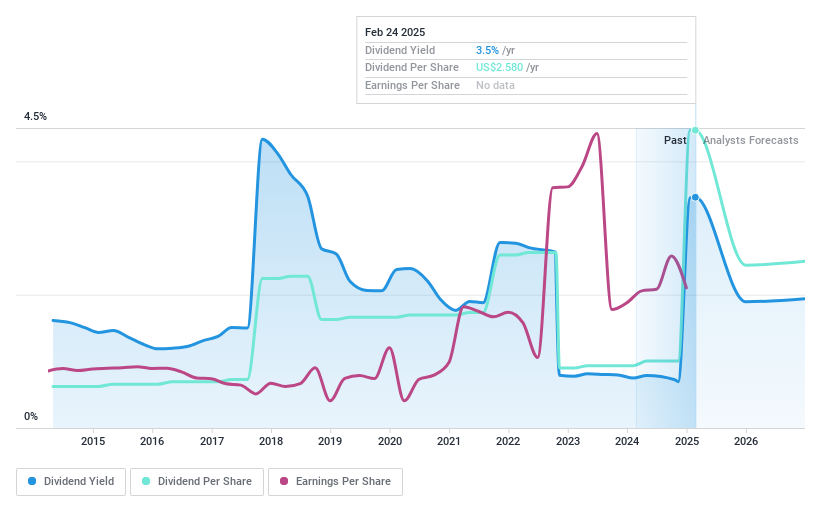
RLI (NYSE:RLI)
Simply Wall St Dividend Rating: ★★★★☆☆
Overview: RLI Corp. is an insurance holding company that underwrites property and casualty insurance, with a market cap of approximately $6.83 billion.
Operations: RLI Corp.'s revenue segments consist of Surety at $142.19 million, Casualty at $852.84 million, and Property at $531.38 million.
Dividend Yield: 3.5%
RLI Corp.'s dividend yield of 3.46% is below the top quartile in the U.S., but its low payout ratio of 15.2% ensures dividends are well covered by earnings and cash flows, despite a volatile dividend history over the past decade. Recent earnings growth supports dividend sustainability, with revenue reaching US$1.77 billion in 2024. The company announced a quarterly dividend increase to US$0.15 per share, signaling ongoing shareholder returns amidst acquisition pursuits.
- Get an in-depth perspective on RLI's performance by reading our dividend report here.
- In light of our recent valuation report, it seems possible that RLI is trading beyond its estimated value.
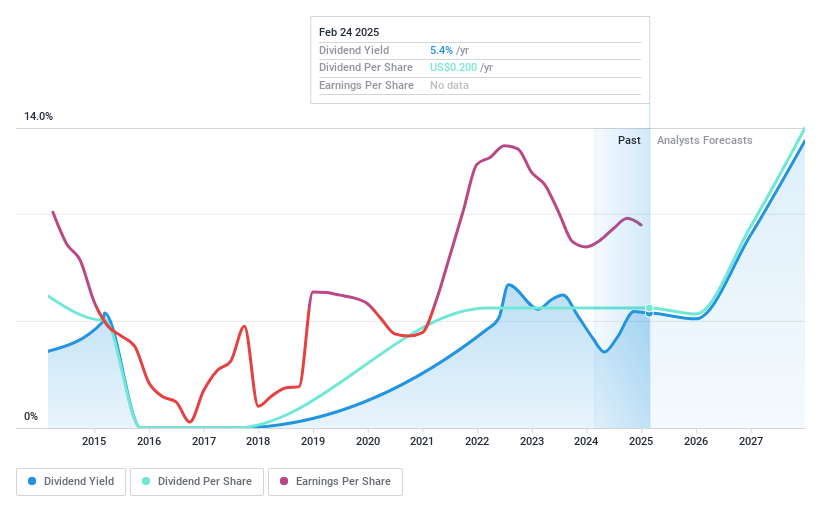
Safe Bulkers (NYSE:SB)
Simply Wall St Dividend Rating: ★★★★☆☆
Overview: Safe Bulkers, Inc., along with its subsidiaries, offers marine drybulk transportation services and has a market cap of approximately $392.77 million.
Operations: Safe Bulkers, Inc. generates revenue primarily from its transportation - shipping segment, totaling approximately $307.63 million.
Dividend Yield: 5.4%
Safe Bulkers' dividend yield is in the top 25% of U.S. payers, supported by a low cash payout ratio of 16.1%, indicating strong coverage by cash flows and earnings despite a volatile history. Recent earnings showed decreased revenue at US$71.49 million for Q4 2024, with net income falling to US$19.36 million from the previous year. The company declared a $0.05 per share dividend payable in March 2025 and completed a share buyback worth $5.66 million, enhancing shareholder value amidst financial fluctuations.
- Click here to discover the nuances of Safe Bulkers with our detailed analytical dividend report.
- Our comprehensive valuation report raises the possibility that Safe Bulkers is priced lower than what may be justified by its financials.
Where To Now?
- Access the full spectrum of 141 Top US Dividend Stocks by clicking on this link.
- Are these companies part of your investment strategy? Use Simply Wall St to consolidate your holdings into a portfolio and gain insights with our comprehensive analysis tools.
- Unlock the power of informed investing with Simply Wall St, your free guide to navigating stock markets worldwide.
Curious About Other Options?
- Explore high-performing small cap companies that haven't yet garnered significant analyst attention.
- Fuel your portfolio with companies showing strong growth potential, backed by optimistic outlooks both from analysts and management.
- Find companies with promising cash flow potential yet trading below their fair value.
This article by Simply Wall St is general in nature. We provide commentary based on historical data and analyst forecasts only using an unbiased methodology and our articles are not intended to be financial advice. It does not constitute a recommendation to buy or sell any stock, and does not take account of your objectives, or your financial situation. We aim to bring you long-term focused analysis driven by fundamental data. Note that our analysis may not factor in the latest price-sensitive company announcements or qualitative material. Simply Wall St has no position in any stocks mentioned.
New: Manage All Your Stock Portfolios in One Place
We've created the ultimate portfolio companion for stock investors, and it's free.
• Connect an unlimited number of Portfolios and see your total in one currency
• Be alerted to new Warning Signs or Risks via email or mobile
• Track the Fair Value of your stocks
Have feedback on this article? Concerned about the content? Get in touch with us directly. Alternatively, email editorial-team@simplywallst.com
About NYSE:SB
Good value with proven track record and pays a dividend.
Similar Companies
Market Insights

Community Narratives

