- United States
- /
- Capital Markets
- /
- NasdaqCM:VALU
3 Dividend Stocks With Yields From 3.2% To 4.9%

Reviewed by Simply Wall St
As the U.S. stock market navigates a landscape marked by fluctuating indices and rising Treasury yields, investors are keeping a close eye on legislative developments that could impact economic growth. In this environment, dividend stocks can offer stability and income potential, making them an attractive option for those looking to balance risk with steady returns amidst market volatility.
Top 10 Dividend Stocks In The United States
| Name | Dividend Yield | Dividend Rating |
| Columbia Banking System (NasdaqGS:COLB) | 5.82% | ★★★★★★ |
| First Interstate BancSystem (NasdaqGS:FIBK) | 6.84% | ★★★★★★ |
| Dillard's (NYSE:DDS) | 6.20% | ★★★★★★ |
| Ennis (NYSE:EBF) | 5.17% | ★★★★★★ |
| Chevron (NYSE:CVX) | 4.98% | ★★★★★★ |
| CompX International (NYSEAM:CIX) | 4.79% | ★★★★★★ |
| Southside Bancshares (NYSE:SBSI) | 4.90% | ★★★★★☆ |
| Valley National Bancorp (NasdaqGS:VLY) | 4.87% | ★★★★★☆ |
| Huntington Bancshares (NasdaqGS:HBAN) | 3.89% | ★★★★★☆ |
| Carter's (NYSE:CRI) | 8.70% | ★★★★★☆ |
Click here to see the full list of 139 stocks from our Top US Dividend Stocks screener.
Here we highlight a subset of our preferred stocks from the screener.
Farmers National Banc (NasdaqCM:FMNB)
Simply Wall St Dividend Rating: ★★★★★☆
Overview: Farmers National Banc Corp. is a bank holding company for The Farmers National Bank of Canfield, offering services in banking, trust, retirement consulting, insurance, and financial management with a market cap of $514.92 million.
Operations: Farmers National Banc Corp. generates revenue primarily through its Bank Segment, which contributes $117.27 million, and its Trust Segment, including retirement consulting services, which adds $13.05 million.
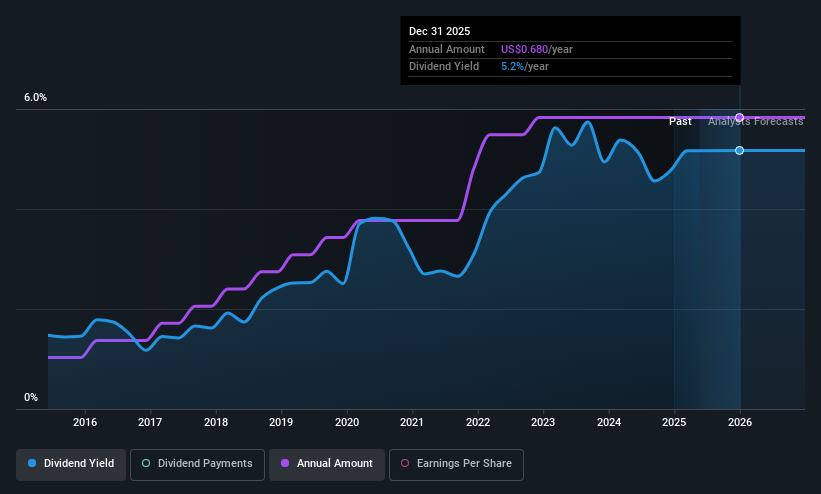
Dividend Yield: 5%
Farmers National Banc offers a stable and reliable dividend, with payments increasing over the past decade. The current yield of 4.98% places it in the top 25% of U.S. dividend payers, supported by a reasonable payout ratio of 52.6%. Despite recent executive changes and net charge-offs decreasing to US$336,000 from US$1 million last year, its strong financial performance—net income rose to US$13.58 million—bolsters its dividend sustainability.
- Unlock comprehensive insights into our analysis of Farmers National Banc stock in this dividend report.
- In light of our recent valuation report, it seems possible that Farmers National Banc is trading behind its estimated value.
Value Line (NasdaqCM:VALU)
Simply Wall St Dividend Rating: ★★★★★☆
Overview: Value Line, Inc. is involved in producing and selling investment periodicals and related publications, with a market cap of $375.98 million.
Operations: Value Line, Inc.'s revenue is primarily derived from its publishing segment, which generated $35.70 million.
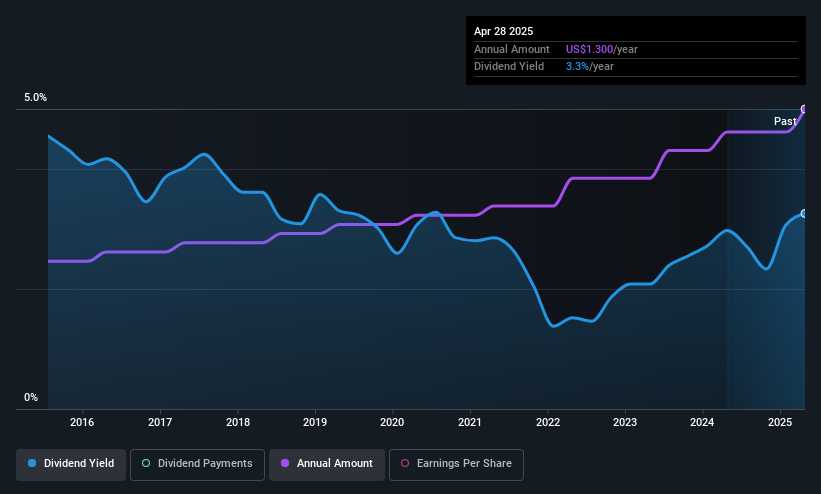
Dividend Yield: 3.3%
Value Line's recent dividend increase to $0.325 per share marks its 11th consecutive annual rise, reflecting a stable and growing payout history. Despite a slight decline in quarterly revenue to US$8.97 million, nine-month net income improved to US$16.74 million, supporting dividend sustainability with payout ratios of 52.5% (earnings) and 67.2% (cash flow). While the yield of 3.27% is below top-tier U.S. payers, it remains reliable and well-covered by financials.
- Dive into the specifics of Value Line here with our thorough dividend report.
- In light of our recent valuation report, it seems possible that Value Line is trading beyond its estimated value.
Shore Bancshares (NasdaqGS:SHBI)
Simply Wall St Dividend Rating: ★★★★☆☆
Overview: Shore Bancshares, Inc. operates as a bank holding company for Shore United Bank, N.A., with a market cap of $496.94 million.
Operations: Shore Bancshares, Inc. generates revenue primarily through its Community Banking segment, which accounts for $201.67 million.
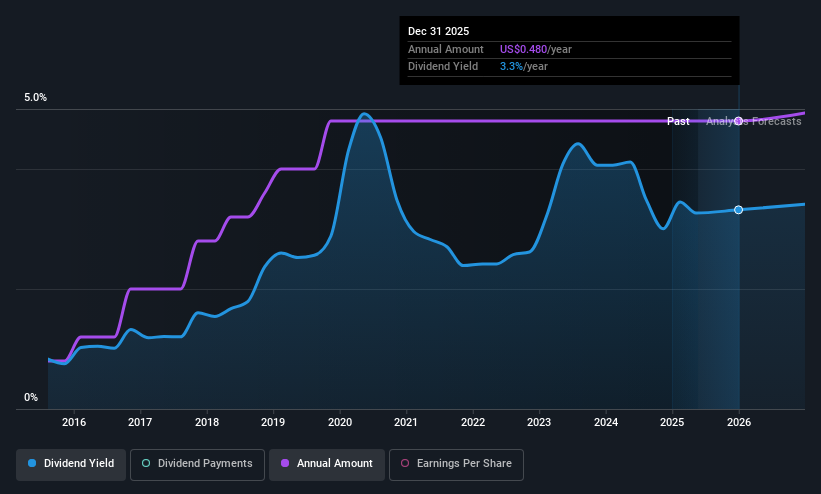
Dividend Yield: 3.2%
Shore Bancshares declared a quarterly dividend of $0.12 per share, maintaining its stable 10-year payout history. With a payout ratio of 32.3%, dividends are well covered by earnings, supported by net income growth to US$13.76 million in Q1 2025 from US$8.18 million the previous year. Although the yield of 3.2% is below top-tier U.S. payers, it remains reliable and attractive given the company's consistent financial performance and low price-to-earnings ratio of 10.1x compared to the market average.
- Click here to discover the nuances of Shore Bancshares with our detailed analytical dividend report.
- The analysis detailed in our Shore Bancshares valuation report hints at an inflated share price compared to its estimated value.
Next Steps
- Embark on your investment journey to our 139 Top US Dividend Stocks selection here.
- Are these companies part of your investment strategy? Use Simply Wall St to consolidate your holdings into a portfolio and gain insights with our comprehensive analysis tools.
- Invest smarter with the free Simply Wall St app providing detailed insights into every stock market around the globe.
Curious About Other Options?
- Explore high-performing small cap companies that haven't yet garnered significant analyst attention.
- Fuel your portfolio with companies showing strong growth potential, backed by optimistic outlooks both from analysts and management.
- Find companies with promising cash flow potential yet trading below their fair value.
This article by Simply Wall St is general in nature. We provide commentary based on historical data and analyst forecasts only using an unbiased methodology and our articles are not intended to be financial advice. It does not constitute a recommendation to buy or sell any stock, and does not take account of your objectives, or your financial situation. We aim to bring you long-term focused analysis driven by fundamental data. Note that our analysis may not factor in the latest price-sensitive company announcements or qualitative material. Simply Wall St has no position in any stocks mentioned.
If you're looking to trade Value Line, open an account with the lowest-cost platform trusted by professionals, Interactive Brokers.
With clients in over 200 countries and territories, and access to 160 markets, IBKR lets you trade stocks, options, futures, forex, bonds and funds from a single integrated account.
Enjoy no hidden fees, no account minimums, and FX conversion rates as low as 0.03%, far better than what most brokers offer.
Sponsored ContentNew: Manage All Your Stock Portfolios in One Place
We've created the ultimate portfolio companion for stock investors, and it's free.
• Connect an unlimited number of Portfolios and see your total in one currency
• Be alerted to new Warning Signs or Risks via email or mobile
• Track the Fair Value of your stocks
Have feedback on this article? Concerned about the content? Get in touch with us directly. Alternatively, email editorial-team@simplywallst.com
About NasdaqCM:VALU
Value Line
Engages in the production and sale of investment periodicals and related publications.
Outstanding track record with flawless balance sheet and pays a dividend.
Similar Companies
Market Insights

Community Narratives


