
Advertisement
- United States
- /
- Hospitality
- /
- NYSE:SIX
Are Investors Undervaluing Six Flags Entertainment Corporation (NYSE:SIX) By 24%?

Key Insights
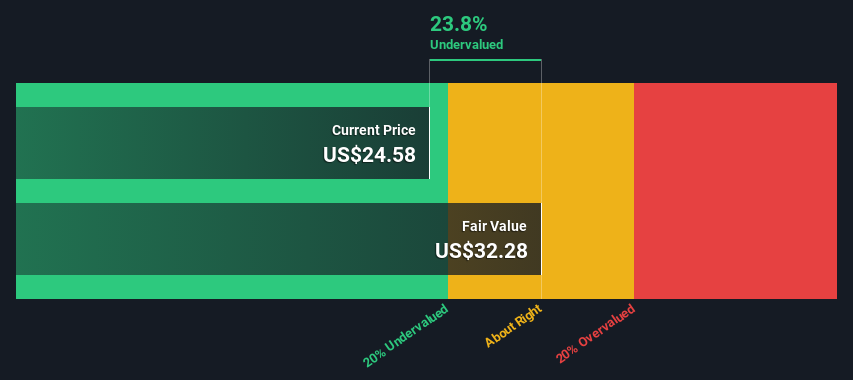
- Six Flags Entertainment's estimated fair value is US$32.28 based on 2 Stage Free Cash Flow to Equity
- Current share price of US$24.58 suggests Six Flags Entertainment is potentially 24% undervalued
- The US$33.14 analyst price target for SIX is 2.7% more than our estimate of fair value
How far off is Six Flags Entertainment Corporation (NYSE:SIX) from its intrinsic value? Using the most recent financial data, we'll take a look at whether the stock is fairly priced by taking the expected future cash flows and discounting them to today's value. We will take advantage of the Discounted Cash Flow (DCF) model for this purpose. Don't get put off by the jargon, the math behind it is actually quite straightforward.
We generally believe that a company's value is the present value of all of the cash it will generate in the future. However, a DCF is just one valuation metric among many, and it is not without flaws. If you want to learn more about discounted cash flow, the rationale behind this calculation can be read in detail in the Simply Wall St analysis model.
View our latest analysis for Six Flags Entertainment
What's The Estimated Valuation?
We use what is known as a 2-stage model, which simply means we have two different periods of growth rates for the company's cash flows. Generally the first stage is higher growth, and the second stage is a lower growth phase. To start off with, we need to estimate the next ten years of cash flows. Where possible we use analyst estimates, but when these aren't available we extrapolate the previous free cash flow (FCF) from the last estimate or reported value. We assume companies with shrinking free cash flow will slow their rate of shrinkage, and that companies with growing free cash flow will see their growth rate slow, over this period. We do this to reflect that growth tends to slow more in the early years than it does in later years.
Generally we assume that a dollar today is more valuable than a dollar in the future, so we need to discount the sum of these future cash flows to arrive at a present value estimate:
10-year free cash flow (FCF) forecast
| 2024 | 2025 | 2026 | 2027 | 2028 | 2029 | 2030 | 2031 | 2032 | 2033 | |
| Levered FCF ($, Millions) | US$258.9m | US$272.8m | US$284.8m | US$295.4m | US$304.9m | US$313.7m | US$322.1m | US$330.1m | US$338.0m | US$345.7m |
| Growth Rate Estimate Source | Analyst x5 | Est @ 5.38% | Est @ 4.40% | Est @ 3.71% | Est @ 3.23% | Est @ 2.90% | Est @ 2.66% | Est @ 2.49% | Est @ 2.38% | Est @ 2.30% |
| Present Value ($, Millions) Discounted @ 13% | US$230 | US$215 | US$200 | US$184 | US$169 | US$155 | US$141 | US$128 | US$117 | US$106 |
("Est" = FCF growth rate estimated by Simply Wall St)
Present Value of 10-year Cash Flow (PVCF) = US$1.6b
The second stage is also known as Terminal Value, this is the business's cash flow after the first stage. For a number of reasons a very conservative growth rate is used that cannot exceed that of a country's GDP growth. In this case we have used the 5-year average of the 10-year government bond yield (2.1%) to estimate future growth. In the same way as with the 10-year 'growth' period, we discount future cash flows to today's value, using a cost of equity of 13%.
Terminal Value (TV)= FCF2033 × (1 + g) ÷ (r – g) = US$346m× (1 + 2.1%) ÷ (13%– 2.1%) = US$3.4b
Present Value of Terminal Value (PVTV)= TV / (1 + r)10= US$3.4b÷ ( 1 + 13%)10= US$1.0b
The total value, or equity value, is then the sum of the present value of the future cash flows, which in this case is US$2.7b. In the final step we divide the equity value by the number of shares outstanding. Relative to the current share price of US$24.6, the company appears a touch undervalued at a 24% discount to where the stock price trades currently. Remember though, that this is just an approximate valuation, and like any complex formula - garbage in, garbage out.
Important Assumptions
We would point out that the most important inputs to a discounted cash flow are the discount rate and of course the actual cash flows. Part of investing is coming up with your own evaluation of a company's future performance, so try the calculation yourself and check your own assumptions. The DCF also does not consider the possible cyclicality of an industry, or a company's future capital requirements, so it does not give a full picture of a company's potential performance. Given that we are looking at Six Flags Entertainment as potential shareholders, the cost of equity is used as the discount rate, rather than the cost of capital (or weighted average cost of capital, WACC) which accounts for debt. In this calculation we've used 13%, which is based on a levered beta of 1.753. Beta is a measure of a stock's volatility, compared to the market as a whole. We get our beta from the industry average beta of globally comparable companies, with an imposed limit between 0.8 and 2.0, which is a reasonable range for a stable business.
SWOT Analysis for Six Flags Entertainment
Strength
- No major strengths identified for SIX.
Weakness
- Earnings declined over the past year.
- Interest payments on debt are not well covered.
Opportunity
- Annual earnings are forecast to grow faster than the American market.
- Good value based on P/E ratio and estimated fair value.
- Significant insider buying over the past 3 months.
Threat
- Debt is not well covered by operating cash flow.
- Total liabilities exceed total assets, which raises the risk of financial distress.
- Annual revenue is forecast to grow slower than the American market.
Looking Ahead:
Whilst important, the DCF calculation is only one of many factors that you need to assess for a company. DCF models are not the be-all and end-all of investment valuation. Rather it should be seen as a guide to "what assumptions need to be true for this stock to be under/overvalued?" If a company grows at a different rate, or if its cost of equity or risk free rate changes sharply, the output can look very different. Can we work out why the company is trading at a discount to intrinsic value? For Six Flags Entertainment, we've put together three pertinent elements you should look at:
- Risks: Every company has them, and we've spotted 2 warning signs for Six Flags Entertainment you should know about.
- Management:Have insiders been ramping up their shares to take advantage of the market's sentiment for SIX's future outlook? Check out our management and board analysis with insights on CEO compensation and governance factors.
- Other Solid Businesses: Low debt, high returns on equity and good past performance are fundamental to a strong business. Why not explore our interactive list of stocks with solid business fundamentals to see if there are other companies you may not have considered!
PS. Simply Wall St updates its DCF calculation for every American stock every day, so if you want to find the intrinsic value of any other stock just search here.
New: Manage All Your Stock Portfolios in One Place
We've created the ultimate portfolio companion for stock investors, and it's free.
• Connect an unlimited number of Portfolios and see your total in one currency
• Be alerted to new Warning Signs or Risks via email or mobile
• Track the Fair Value of your stocks
Have feedback on this article? Concerned about the content? Get in touch with us directly. Alternatively, email editorial-team (at) simplywallst.com.
This article by Simply Wall St is general in nature. We provide commentary based on historical data and analyst forecasts only using an unbiased methodology and our articles are not intended to be financial advice. It does not constitute a recommendation to buy or sell any stock, and does not take account of your objectives, or your financial situation. We aim to bring you long-term focused analysis driven by fundamental data. Note that our analysis may not factor in the latest price-sensitive company announcements or qualitative material. Simply Wall St has no position in any stocks mentioned.
About NYSE:SIX
Six Flags Entertainment
Owns and operates regional theme and waterparks under the Six Flags name.
Moderate growth potential and slightly overvalued.
Similar Companies
Market Insights

Advertisement
Community Narratives
Pinterest will surge as advertising innovations ignite revenue growth
Fair Value US$42.63|26.1% undervalued
BR
Community Contributor
Brambles' Revenue Set to Climb 14% with Profit Margins Following
Fair Value AU$21.90|4.8% overvalued
RO
Community Contributor
Challenging Future for STG as Organic Sales Decline by 8.8%
Fair Value DKK 116.13|27.0% undervalued
KA
Community Contributor