- United States
- /
- Hospitality
- /
- NYSE:EAT
A Look At The Intrinsic Value Of Brinker International, Inc. (NYSE:EAT)


Key Insights
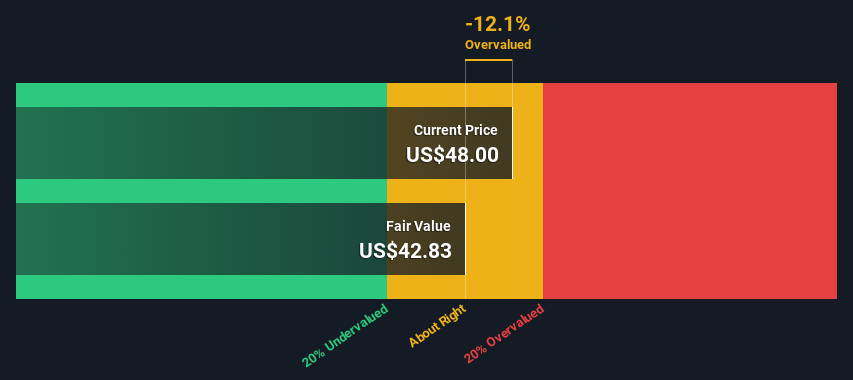
- Using the 2 Stage Free Cash Flow to Equity, Brinker International fair value estimate is US$42.83
- With US$48.00 share price, Brinker International appears to be trading close to its estimated fair value
- The US$47.93 analyst price target for EAT is 12% more than our estimate of fair value
Does the April share price for Brinker International, Inc. (NYSE:EAT) reflect what it's really worth? Today, we will estimate the stock's intrinsic value by projecting its future cash flows and then discounting them to today's value. Our analysis will employ the Discounted Cash Flow (DCF) model. It may sound complicated, but actually it is quite simple!
Remember though, that there are many ways to estimate a company's value, and a DCF is just one method. Anyone interested in learning a bit more about intrinsic value should have a read of the Simply Wall St analysis model.
Check out our latest analysis for Brinker International
Is Brinker International Fairly Valued?
We're using the 2-stage growth model, which simply means we take in account two stages of company's growth. In the initial period the company may have a higher growth rate and the second stage is usually assumed to have a stable growth rate. To start off with, we need to estimate the next ten years of cash flows. Where possible we use analyst estimates, but when these aren't available we extrapolate the previous free cash flow (FCF) from the last estimate or reported value. We assume companies with shrinking free cash flow will slow their rate of shrinkage, and that companies with growing free cash flow will see their growth rate slow, over this period. We do this to reflect that growth tends to slow more in the early years than it does in later years.
Generally we assume that a dollar today is more valuable than a dollar in the future, and so the sum of these future cash flows is then discounted to today's value:
10-year free cash flow (FCF) estimate
| 2024 | 2025 | 2026 | 2027 | 2028 | 2029 | 2030 | 2031 | 2032 | 2033 | |
| Levered FCF ($, Millions) | US$160.1m | US$159.2m | US$160.8m | US$160.7m | US$161.7m | US$163.6m | US$166.0m | US$168.9m | US$172.1m | US$175.5m |
| Growth Rate Estimate Source | Analyst x4 | Analyst x4 | Analyst x1 | Est @ -0.06% | Est @ 0.64% | Est @ 1.14% | Est @ 1.48% | Est @ 1.72% | Est @ 1.89% | Est @ 2.01% |
| Present Value ($, Millions) Discounted @ 10% | US$146 | US$131 | US$121 | US$110 | US$100 | US$92.2 | US$85.0 | US$78.6 | US$72.8 | US$67.5 |
("Est" = FCF growth rate estimated by Simply Wall St)
Present Value of 10-year Cash Flow (PVCF) = US$1.0b
We now need to calculate the Terminal Value, which accounts for all the future cash flows after this ten year period. The Gordon Growth formula is used to calculate Terminal Value at a future annual growth rate equal to the 5-year average of the 10-year government bond yield of 2.3%. We discount the terminal cash flows to today's value at a cost of equity of 10%.
Terminal Value (TV)= FCF2033 × (1 + g) ÷ (r – g) = US$176m× (1 + 2.3%) ÷ (10%– 2.3%) = US$2.3b
Present Value of Terminal Value (PVTV)= TV / (1 + r)10= US$2.3b÷ ( 1 + 10%)10= US$891m
The total value is the sum of cash flows for the next ten years plus the discounted terminal value, which results in the Total Equity Value, which in this case is US$1.9b. The last step is to then divide the equity value by the number of shares outstanding. Compared to the current share price of US$48.0, the company appears around fair value at the time of writing. The assumptions in any calculation have a big impact on the valuation, so it is better to view this as a rough estimate, not precise down to the last cent.
The Assumptions
The calculation above is very dependent on two assumptions. The first is the discount rate and the other is the cash flows. If you don't agree with these result, have a go at the calculation yourself and play with the assumptions. The DCF also does not consider the possible cyclicality of an industry, or a company's future capital requirements, so it does not give a full picture of a company's potential performance. Given that we are looking at Brinker International as potential shareholders, the cost of equity is used as the discount rate, rather than the cost of capital (or weighted average cost of capital, WACC) which accounts for debt. In this calculation we've used 10%, which is based on a levered beta of 1.684. Beta is a measure of a stock's volatility, compared to the market as a whole. We get our beta from the industry average beta of globally comparable companies, with an imposed limit between 0.8 and 2.0, which is a reasonable range for a stable business.
SWOT Analysis for Brinker International
- Earnings growth over the past year exceeded the industry.
- Debt is well covered by earnings and cashflows.
- No major weaknesses identified for EAT.
- Annual earnings are forecast to grow for the next 3 years.
- Good value based on P/E ratio compared to estimated Fair P/E ratio.
- Total liabilities exceed total assets, which raises the risk of financial distress.
- Annual earnings are forecast to grow slower than the American market.
Next Steps:
Whilst important, the DCF calculation shouldn't be the only metric you look at when researching a company. DCF models are not the be-all and end-all of investment valuation. Rather it should be seen as a guide to "what assumptions need to be true for this stock to be under/overvalued?" For instance, if the terminal value growth rate is adjusted slightly, it can dramatically alter the overall result. For Brinker International, we've compiled three further items you should further research:
- Risks: To that end, you should be aware of the 3 warning signs we've spotted with Brinker International .
- Management:Have insiders been ramping up their shares to take advantage of the market's sentiment for EAT's future outlook? Check out our management and board analysis with insights on CEO compensation and governance factors.
- Other Solid Businesses: Low debt, high returns on equity and good past performance are fundamental to a strong business. Why not explore our interactive list of stocks with solid business fundamentals to see if there are other companies you may not have considered!
PS. Simply Wall St updates its DCF calculation for every American stock every day, so if you want to find the intrinsic value of any other stock just search here.
Valuation is complex, but we're here to simplify it.
Discover if Brinker International might be undervalued or overvalued with our detailed analysis, featuring fair value estimates, potential risks, dividends, insider trades, and its financial condition.
Access Free AnalysisHave feedback on this article? Concerned about the content? Get in touch with us directly. Alternatively, email editorial-team (at) simplywallst.com.
This article by Simply Wall St is general in nature. We provide commentary based on historical data and analyst forecasts only using an unbiased methodology and our articles are not intended to be financial advice. It does not constitute a recommendation to buy or sell any stock, and does not take account of your objectives, or your financial situation. We aim to bring you long-term focused analysis driven by fundamental data. Note that our analysis may not factor in the latest price-sensitive company announcements or qualitative material. Simply Wall St has no position in any stocks mentioned.
About NYSE:EAT
Brinker International
Engages in the ownership, development, operation, and franchising of casual dining restaurants in the United States and internationally.
Solid track record with reasonable growth potential.
