Advertisement
- United States
- /
- Hospitality
- /
- NasdaqGS:TCOM
Does Trip.com Group Offer Growth Potential for 2025 After Strong Earnings Momentum?

Reviewed by Bailey Pemberton
Trying to figure out what to do with Trip.com Group stock? You are not alone. It is a name that keeps popping up for investors searching for growth, resilience, and potential bargains in the travel sector. Over the past year, Trip.com Group’s journey has been anything but boring. Yes, the stock dipped 3.7% in the last week, but if you zoom out, it is up 0.7% over the past month and 13.2% since the start of the year. In fact, if you were holding shares for the last three or even five years, you have seen jaw-dropping returns of 176.9% and 126.9%, respectively. That type of long-term momentum is hard to ignore, and it is drawing more attention as pandemic-era worries fade and travel patterns keep evolving.
What is fueling those moves? Part of it is the broader rebound in global travel, as restrictions have lifted and more people are eager to get back out exploring. There is also a sense that demand could remain robust for the foreseeable future, supporting the company’s business fundamentals. And yet, despite all these gains, Trip.com Group still appears undervalued by most major yardsticks. Out of six different valuation checks, the company scores a strong five, suggesting that the current price could represent real upside if market conditions hold steady.
So, how do all these valuation approaches stack up, and what do they really tell us about Trip.com Group’s future? Let’s dive into the numbers and try to make sense of the company’s valuation. Stick around, because I will reveal one perspective that might change how you think about value altogether.
Why Trip.com Group is lagging behind its peers
Approach 1: Trip.com Group Discounted Cash Flow (DCF) Analysis
The Discounted Cash Flow (DCF) model is a tried-and-true way of valuing a company by estimating its future free cash flows, then discounting those projections back to today’s value. Essentially, it’s a forward-looking math problem that reveals what Trip.com Group could be worth right now if you factor in its future earning power.
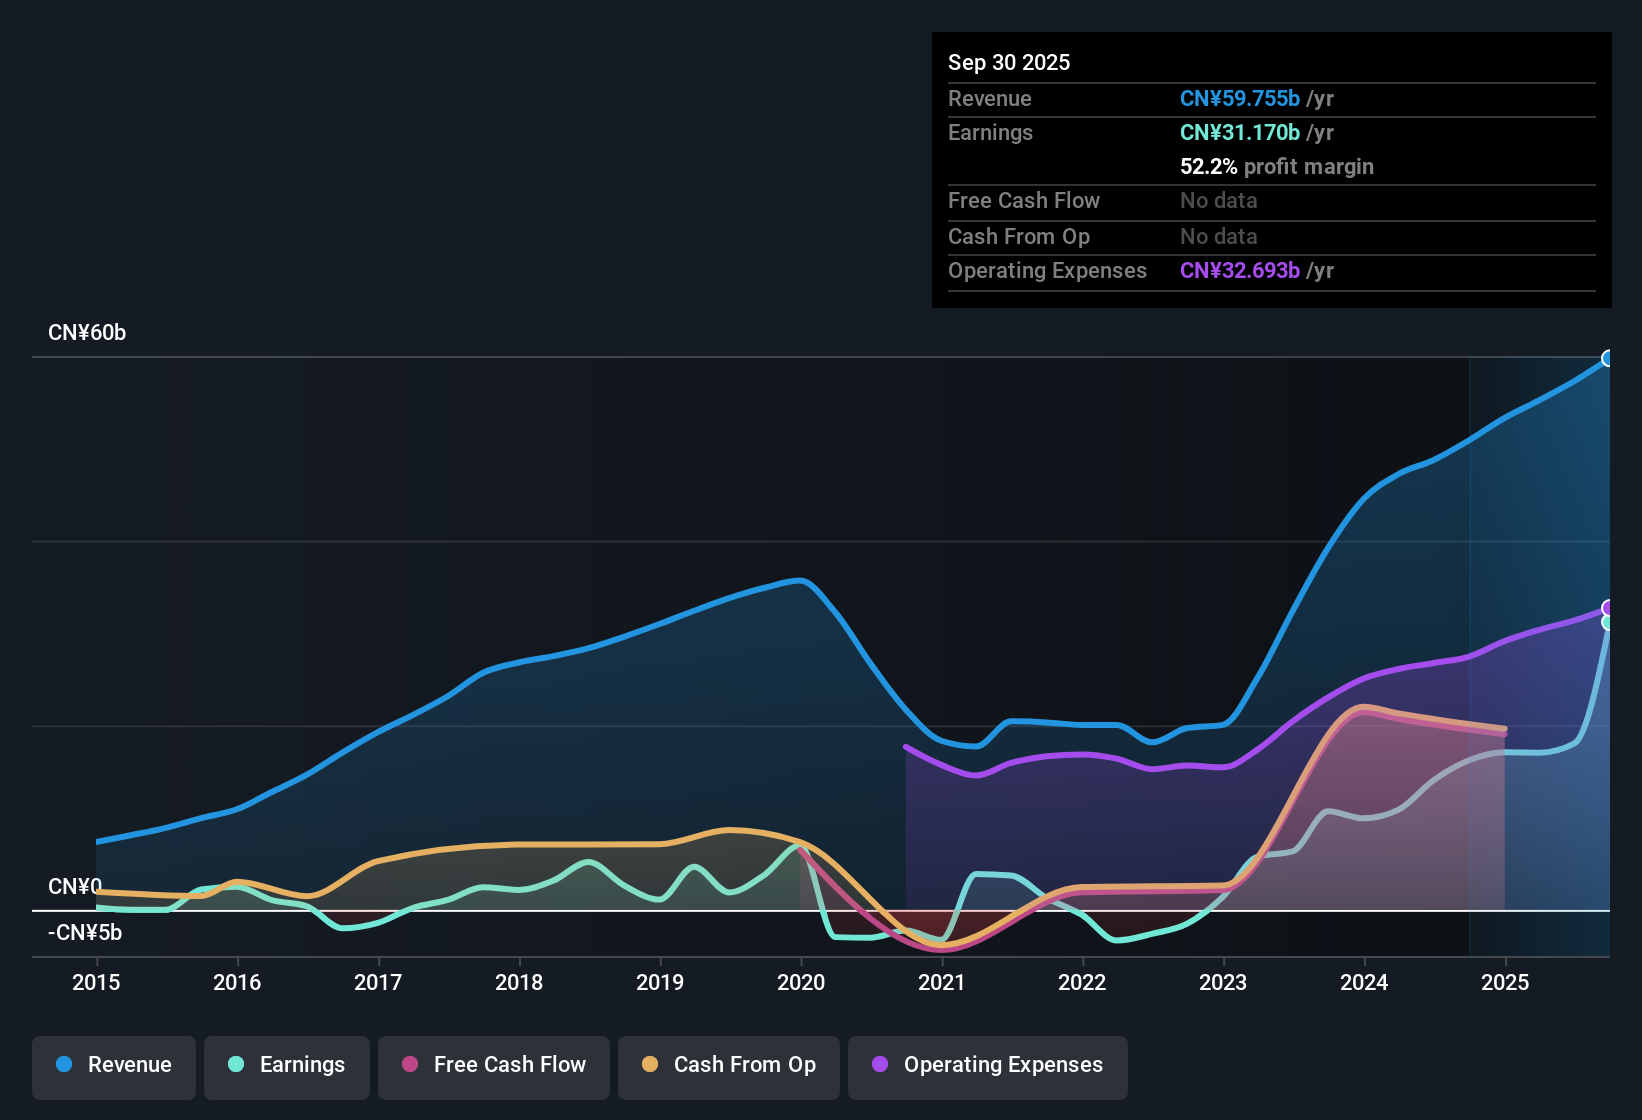
For Trip.com Group, the current Free Cash Flow stands at CN¥18.97 billion. Analysts have forecasted that this figure will continue to grow, with projections showing the free cash flow climbing to CN¥40.90 billion ten years from now (2035). That long-term outlook is based on a blend of direct analyst forecasts for the next five years, then extending the trend using Simply Wall St’s modeling methods. The steady increase in free cash flow reflects a business with robust fundamentals and a promising path ahead.
After crunching the numbers, the estimated fair value per share comes out to $126.34. Compared to the current market price, this DCF calculation suggests the stock is trading at a 42.0% discount. This means Trip.com Group shares are substantially undervalued if these projections hold true.
Result: UNDERVALUED
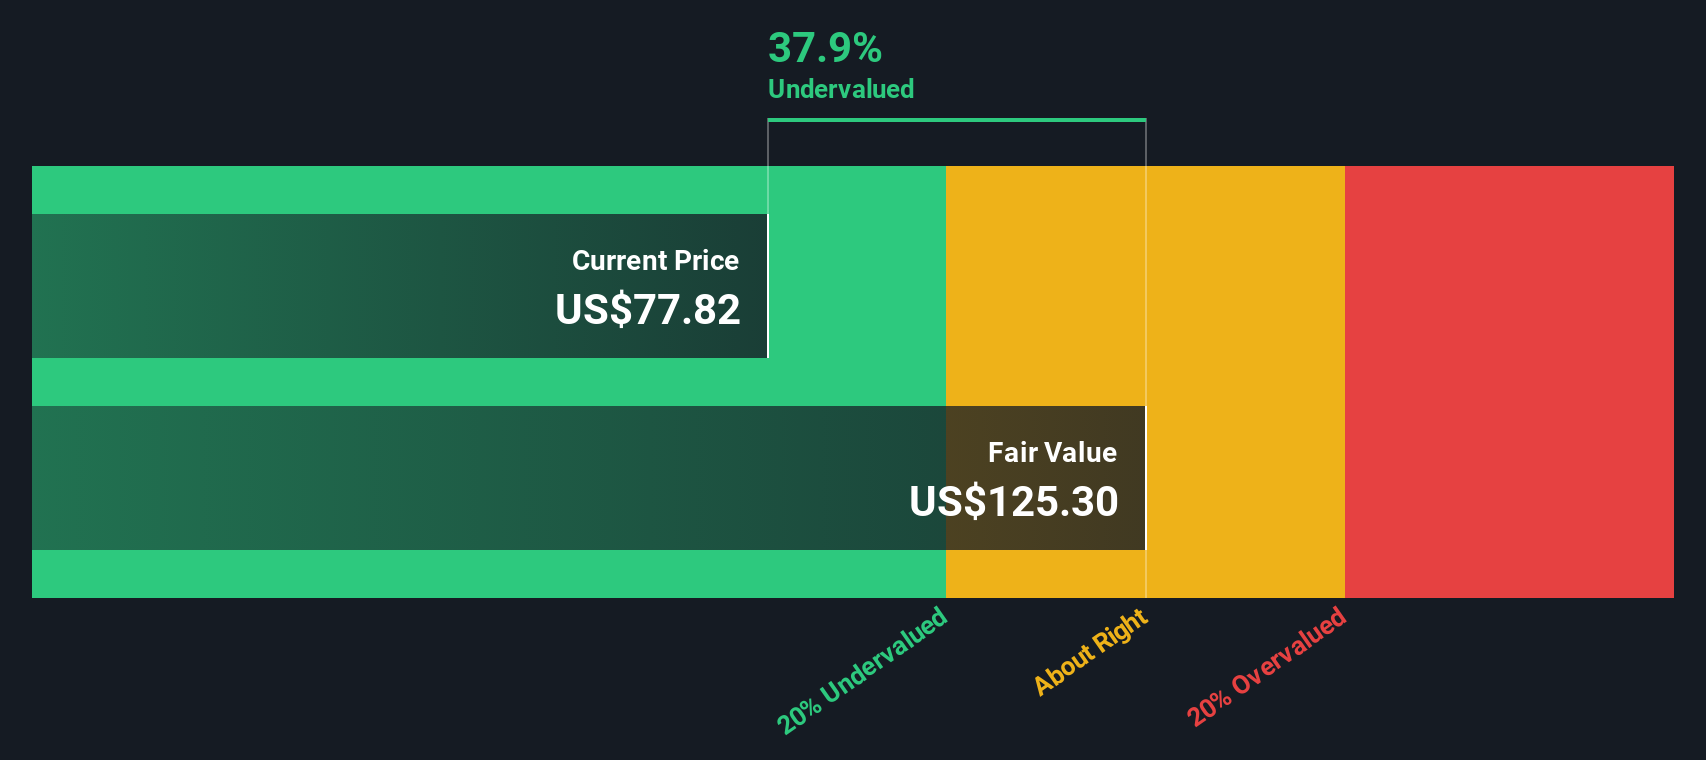
Our Discounted Cash Flow (DCF) analysis suggests Trip.com Group is undervalued by 42.0%. Track this in your watchlist or portfolio, or discover more undervalued stocks.
Approach 2: Trip.com Group Price vs Earnings (P/E Ratio)
For profitable companies like Trip.com Group, the Price-to-Earnings (P/E) ratio is a highly relevant valuation tool. This ratio tells investors how much they are paying for each dollar of a company's current profits, offering a quick sense of the market's expectations for future growth and its tolerance for risk. A higher P/E can signal optimism about a company’s growth outlook, while a lower one might suggest caution or lower anticipated growth.
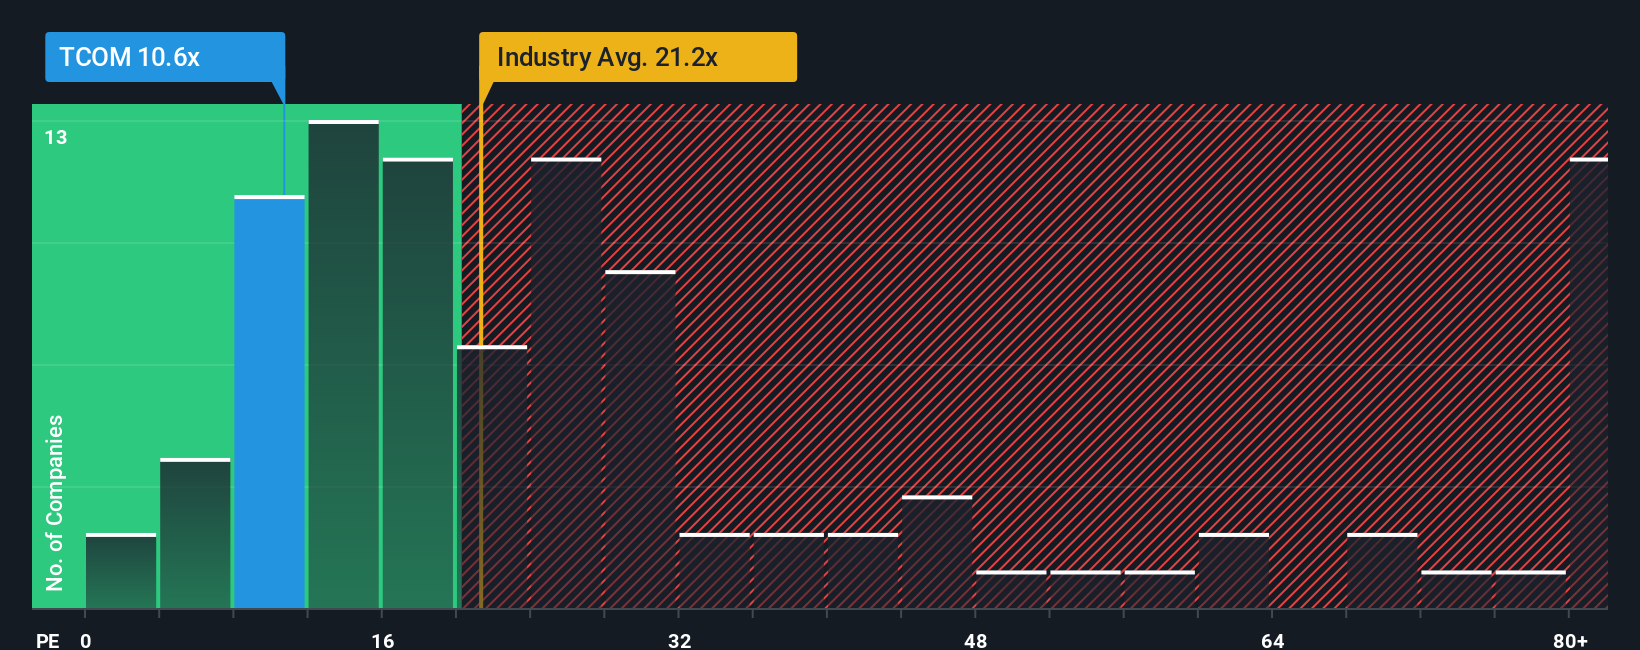
Trip.com Group currently trades at an 18.9x P/E ratio. When compared to the Hospitality industry average of 24.4x and the peer average of 26.0x, Trip.com Group appears to be priced more conservatively. However, headline P/E ratios do not tell the whole story. What really matters is how the company’s unique characteristics influence what a “fair” multiple should be.
This is where Simply Wall St’s “Fair Ratio” comes in. Unlike simple comparisons to industry averages or peers, the Fair Ratio factors in the company’s own earnings growth rate, profit margins, risk profile, industry nuances, and market cap. For Trip.com Group, the Fair Ratio is estimated at 24.7x, reflecting its strong fundamentals and growth potential.
Looking at the numbers, Trip.com Group’s actual P/E of 18.9x is notably lower than both its Fair Ratio and the industry benchmarks. This suggests that, relative to its earnings outlook and risk, the stock is trading at an attractive valuation that could present upside for patient investors.
Result: UNDERVALUED
PE ratios tell one story, but what if the real opportunity lies elsewhere? Discover companies where insiders are betting big on explosive growth.
Upgrade Your Decision Making: Choose your Trip.com Group Narrative
Earlier we mentioned that there's an even better way to understand valuation, so let's introduce you to Narratives. A Narrative is simply your story about a company, connecting why you believe it will succeed (or not) to how you think its financials and value will evolve. Instead of just looking at numbers, a Narrative lets you clearly lay out your assumptions for Trip.com Group’s future, such as revenue growth, profit margins, and risks. You can then see how those forecasts translate into fair value and investment decisions.
On Simply Wall St’s Community page, Narratives make this powerful approach easy and accessible for everyone. You can build your own view or see how others, including millions of investors, are thinking about Trip.com Group, each with a rationale tied to actual forecasts. This helps you decide when to buy or sell by comparing your personalized Fair Value to the current Price. Because Narratives update with each earnings report or news event, your decision framework always stays fresh.
For example, one investor’s Narrative might see Trip.com Group as underpriced based on rapid Asia-Pacific growth and margin expansion. Another investor might envision slower earnings due to intense competition and pricing pressure, resulting in a lower valuation. Narratives empower you to invest with a story and strategy that actually reflect your beliefs.
Do you think there's more to the story for Trip.com Group? Create your own Narrative to let the Community know!
This article by Simply Wall St is general in nature. We provide commentary based on historical data and analyst forecasts only using an unbiased methodology and our articles are not intended to be financial advice. It does not constitute a recommendation to buy or sell any stock, and does not take account of your objectives, or your financial situation. We aim to bring you long-term focused analysis driven by fundamental data. Note that our analysis may not factor in the latest price-sensitive company announcements or qualitative material. Simply Wall St has no position in any stocks mentioned.
Valuation is complex, but we're here to simplify it.
Discover if Trip.com Group might be undervalued or overvalued with our detailed analysis, featuring fair value estimates, potential risks, dividends, insider trades, and its financial condition.
Access Free AnalysisHave feedback on this article? Concerned about the content? Get in touch with us directly. Alternatively, email editorial-team@simplywallst.com
About NasdaqGS:TCOM
Trip.com Group
Through its subsidiaries, operates as a travel service provider for accommodation reservation, transportation ticketing, packaged tours, in-destination, corporate travel management, and other travel-related services in China and internationally.
Very undervalued with flawless balance sheet.
Similar Companies
Market Insights


Advertisement
Weekly Picks
RI


Rick_Orford on Upside Gold ·
This OVERLOOKED Gold Stock Could TRIPLE - 3.3M Ounces, Bottom-of-Peer Valuation
Fair Value:CA$466.3% undervalued
8 followersusers have followed this narrative
0 commentsusers have commented on this narrative
1 likeusers have liked this narrative
CL


Clive_Thompson on Take-Two Interactive Software ·
Take-Two Interactive: The Calm Before the Storm NASDAQ: TTWO Last Price: $242.41 Date: May 15, 2026
Fair Value:US$276.9720.3% undervalued
39 followersusers have followed this narrative
0 commentsusers have commented on this narrative
10 likesusers have liked this narrative
NI


niteco on Honeywell International ·
Honeywell - The Demand-Side of the AI Infrastructure
Fair Value:US$320.1927.6% undervalued
32 followersusers have followed this narrative
0 commentsusers have commented on this narrative
11 likesusers have liked this narrative
BJ


Bjergby on PagSeguro Digital ·
PagSeguro: A Cheap Bet on a Bank Hiding Inside a Payments Company, Priced for Failure
Fair Value:US$19.252.0% undervalued
13 followersusers have followed this narrative
0 commentsusers have commented on this narrative
3 likesusers have liked this narrative
Recently Updated Narratives
DE


Delphic on NuScale Power ·
NuScale is Postioned For Long-Term Growth
Fair Value:US$10087.8% undervalued
1 followerusers have followed this narrative
0 commentsusers have commented on this narrative
0 likesusers have liked this narrative
RO


RockeTeller on Argenta Silver ·
Frank Giustra Backed: The High-Grade Silver Project Acquired for Just $3.5M Could Deliver 30x Silver Torque
Fair Value:CA$40.3598.6% undervalued
14 followersusers have followed this narrative
9 commentsusers have commented on this narrative
1 likeusers have liked this narrative
KA


kapirey on Shenzhou International Group Holdings ·
well-run industrial compounder capable of generating solid long-term returns if management maintains discipline.
Fair Value:HK$42.367.9% overvalued
1 followerusers have followed this narrative
0 commentsusers have commented on this narrative
0 likesusers have liked this narrative
Popular Narratives
GO

GoldenSands on QuantumScape ·
QuantumScape: A Mispriced Deep‑Tech Inflection Point With Multi‑Billion‑Dollar Optionality
Fair Value:US$8589.8% undervalued
116 followersusers have followed this narrative
2 commentsusers have commented on this narrative
33 likesusers have liked this narrative
TR


tripledub on lululemon athletica ·
Lululemon Got Boring Right About the Time It Got Cheap. That's Usually the Point
Fair Value:US$22042.1% undervalued
26 followersusers have followed this narrative
6 commentsusers have commented on this narrative
32 likesusers have liked this narrative
AN


AnalystConsensusTarget on NVIDIA ·
NVDA: Expanding AI Demand Will Drive Major Data Center Investments Through 2026
Fair Value:US$268.6120.0% undervalued
1193 followersusers have followed this narrative
7 commentsusers have commented on this narrative
35 likesusers have liked this narrative

