- United States
- /
- Hospitality
- /
- NasdaqGS:BLMN
Optimism around Bloomin' Brands (NASDAQ:BLMN) delivering new earnings growth may be shrinking as stock declines 3.8% this past week


The simplest way to benefit from a rising market is to buy an index fund. But if you buy individual stocks, you can do both better or worse than that. Unfortunately the Bloomin' Brands, Inc. (NASDAQ:BLMN) share price slid 37% over twelve months. That's disappointing when you consider the market returned 21%. To make matters worse, the returns over three years have also been really disappointing (the share price is 33% lower than three years ago). Shareholders have had an even rougher run lately, with the share price down 13% in the last 90 days.
If the past week is anything to go by, investor sentiment for Bloomin' Brands isn't positive, so let's see if there's a mismatch between fundamentals and the share price.
Check out our latest analysis for Bloomin' Brands
While markets are a powerful pricing mechanism, share prices reflect investor sentiment, not just underlying business performance. One imperfect but simple way to consider how the market perception of a company has shifted is to compare the change in the earnings per share (EPS) with the share price movement.
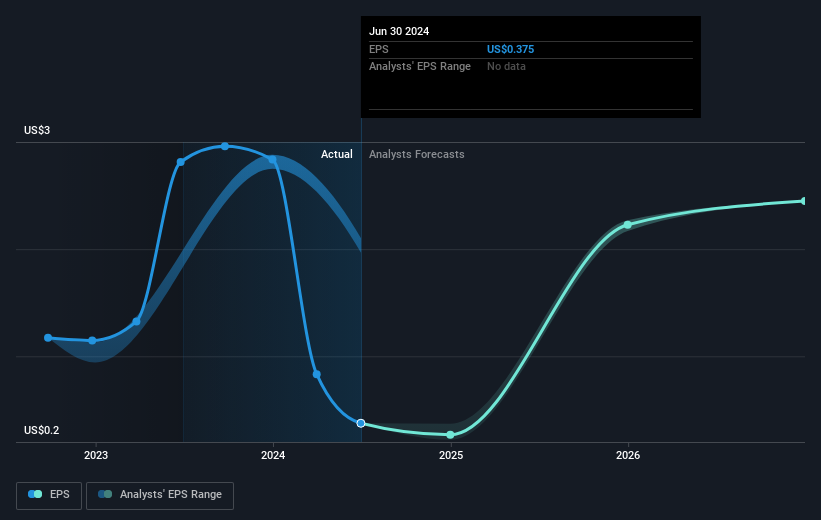
Unhappily, Bloomin' Brands had to report a 87% decline in EPS over the last year. This fall in the EPS is significantly worse than the 37% the share price fall. So despite the weak per-share profits, some investors are probably relieved the situation wasn't more difficult.
The image below shows how EPS has tracked over time (if you click on the image you can see greater detail).
This free interactive report on Bloomin' Brands' earnings, revenue and cash flow is a great place to start, if you want to investigate the stock further.
What About Dividends?
As well as measuring the share price return, investors should also consider the total shareholder return (TSR). Whereas the share price return only reflects the change in the share price, the TSR includes the value of dividends (assuming they were reinvested) and the benefit of any discounted capital raising or spin-off. So for companies that pay a generous dividend, the TSR is often a lot higher than the share price return. As it happens, Bloomin' Brands' TSR for the last 1 year was -35%, which exceeds the share price return mentioned earlier. The dividends paid by the company have thusly boosted the total shareholder return.
A Different Perspective
Investors in Bloomin' Brands had a tough year, with a total loss of 35% (including dividends), against a market gain of about 21%. Even the share prices of good stocks drop sometimes, but we want to see improvements in the fundamental metrics of a business, before getting too interested. Regrettably, last year's performance caps off a bad run, with the shareholders facing a total loss of 1.8% per year over five years. Generally speaking long term share price weakness can be a bad sign, though contrarian investors might want to research the stock in hope of a turnaround. While it is well worth considering the different impacts that market conditions can have on the share price, there are other factors that are even more important. Consider for instance, the ever-present spectre of investment risk. We've identified 4 warning signs with Bloomin' Brands (at least 1 which shouldn't be ignored) , and understanding them should be part of your investment process.
Of course, you might find a fantastic investment by looking elsewhere. So take a peek at this free list of companies we expect will grow earnings.
Please note, the market returns quoted in this article reflect the market weighted average returns of stocks that currently trade on American exchanges.
Valuation is complex, but we're here to simplify it.
Discover if Bloomin' Brands might be undervalued or overvalued with our detailed analysis, featuring fair value estimates, potential risks, dividends, insider trades, and its financial condition.
Access Free AnalysisHave feedback on this article? Concerned about the content? Get in touch with us directly. Alternatively, email editorial-team (at) simplywallst.com.
This article by Simply Wall St is general in nature. We provide commentary based on historical data and analyst forecasts only using an unbiased methodology and our articles are not intended to be financial advice. It does not constitute a recommendation to buy or sell any stock, and does not take account of your objectives, or your financial situation. We aim to bring you long-term focused analysis driven by fundamental data. Note that our analysis may not factor in the latest price-sensitive company announcements or qualitative material. Simply Wall St has no position in any stocks mentioned.
About NasdaqGS:BLMN
Bloomin' Brands
Bloomin’ Brands, Inc., through its subsidiaries, owns and operates casual, upscale casual, and fine dining restaurants in the United States and internationally.
Undervalued with reasonable growth potential.
