Advertisement
- United States
- /
- Consumer Durables
- /
- NYSE:TOL
Is Now the Right Time to Reassess Toll Brothers After Stock Jumped 4% This Week?

Simply Wall St
Reviewed by Bailey Pemberton
If you are sitting on the fence about Toll Brothers, you are far from alone. This luxury homebuilder has seen its stock move dramatically over the years, and lately it has been riding a wave of optimism that has more investors wondering if there is more upside ahead. In just the past week, the stock climbed 4.0%, building on a solid 14.6% return since the start of the year. Step back a bit further and the story gets even more impressive, with shareholders seeing gains of 229.0% over three years and 202.3% over five.
Despite this strong performance, Toll Brothers’ stock price did take a breather in the last year, dipping 4.0%. But with ongoing demand for new homes and a shift in the market’s risk perception toward homebuilders, investors have remained keenly interested. The broad housing market has faced its share of headwinds, yet Toll Brothers continues to turn heads for the right reasons. This is partly because it screens as undervalued in five out of six ways that matter for fundamental analysis, earning a robust valuation score of 5.
So is all this momentum already priced in, or is Toll Brothers still flying under the radar relative to its true value? Next, let’s dig deeper into how the company stacks up across several popular valuation methods. And stick around, because at the end, we will look at an even sharper way to gauge whether Toll Brothers is truly undervalued.
Approach 1: Toll Brothers Discounted Cash Flow (DCF) Analysis
The Discounted Cash Flow (DCF) model evaluates a company's worth by projecting its future free cash flows and discounting them back to today's value. This approach gives investors a sense of what the business is truly worth based on expected performance, rather than just market sentiment or short-term trends.
For Toll Brothers, the latest reported Free Cash Flow (FCF) stands at $920.3 Million. Analysts predict that FCF will grow in the coming years, peaking at $1.83 Billion in 2026 before settling at $1.26 Billion by 2035, based on further extrapolations. These projections use both analyst estimates for the next five years and systematic forecasting for later years. All values are in U.S. Dollars.
Based on these future cash flows and using a 2 Stage Free Cash Flow to Equity model, the resulting estimated intrinsic value for Toll Brothers is $193.73 per share. Compared to the current share price, the DCF model suggests the stock is undervalued by 26.3 percent, providing a significant margin of safety for investors looking for value.
Result: UNDERVALUED
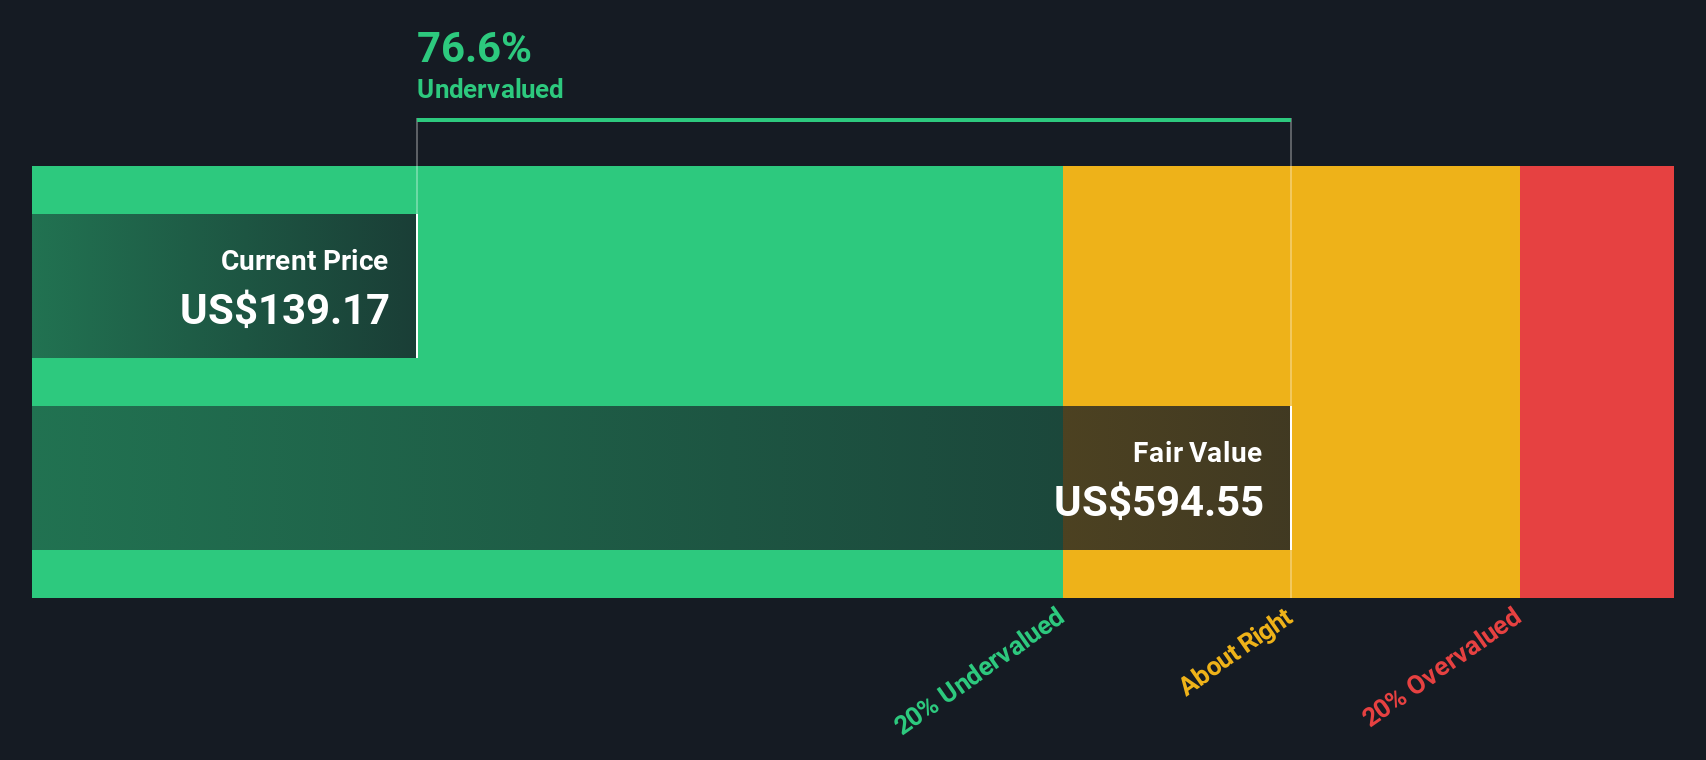
Our Discounted Cash Flow (DCF) analysis suggests Toll Brothers is undervalued by 26.3%. Track this in your watchlist or portfolio, or discover more undervalued stocks.
Approach 2: Toll Brothers Price vs Earnings
The price-to-earnings (PE) ratio is a widely used metric for valuing profitable companies like Toll Brothers because it directly compares a company’s share price to its net earnings. When a business is consistently generating profits, the PE ratio can offer clear insights into how the market views its future growth and profitability.
Growth expectations and perceived risk are important context for interpreting the PE ratio. Companies that are expected to grow earnings faster, or that are seen as less risky, usually justify higher PE multiples. Conversely, slower-growing or riskier businesses typically trade at lower multiples, even within the same industry.
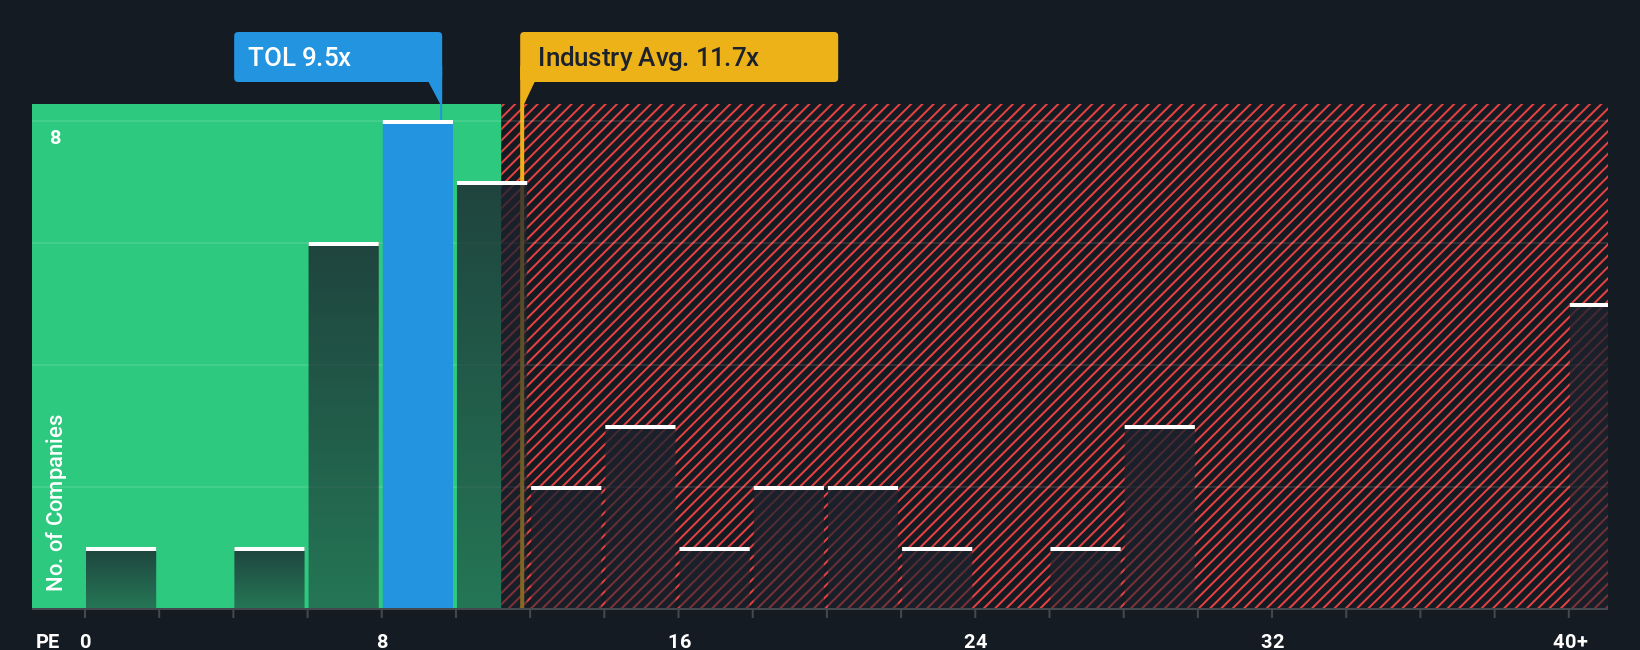
As of today, Toll Brothers is trading at a PE ratio of 10.0x. When we compare this to the Consumer Durables industry average of 11.7x and the peer group average of 17.6x, Toll Brothers looks relatively inexpensive. To provide an even sharper view, Simply Wall St calculates a proprietary “Fair Ratio,” which is a personalized benchmark that factors in Toll Brothers’ earnings growth, industry, profit margin, market cap, and company-specific risks.
Unlike simple comparisons with peers or the industry, the Fair Ratio offers a more complete picture. It accounts for whether Toll Brothers’ profitability and risk profile justify a higher or lower PE, not just how it stacks up to others. For Toll Brothers, the Fair Ratio is calculated at 17.2x. Since its current PE of 10.0x is well below this fair value estimate, this suggests the market is undervaluing the stock based on its fundamentals.
Result: UNDERVALUED
PE ratios tell one story, but what if the real opportunity lies elsewhere? Discover companies where insiders are betting big on explosive growth.
Upgrade Your Decision Making: Choose your Toll Brothers Narrative
Earlier we mentioned that there is an even better way to understand valuation, so let's introduce you to Narratives. A Narrative is your personal story behind the numbers, a way to connect what you believe about Toll Brothers’ future, such as its revenue, profit margins, and risks, with a tailored financial forecast and your own assessment of the company’s fair value. Narratives link the company’s business story to its numbers and help you see how your expectations compare to the current price and to other investors’ perspectives.
Available on Simply Wall St’s Community page, which is used by millions of investors, Narratives make it easy and intuitive to visualize your outlook for Toll Brothers and instantly see whether the stock is under- or over-valued based on your view. Narratives are dynamic and automatically update as new information emerges, so your investment thesis always stays relevant.
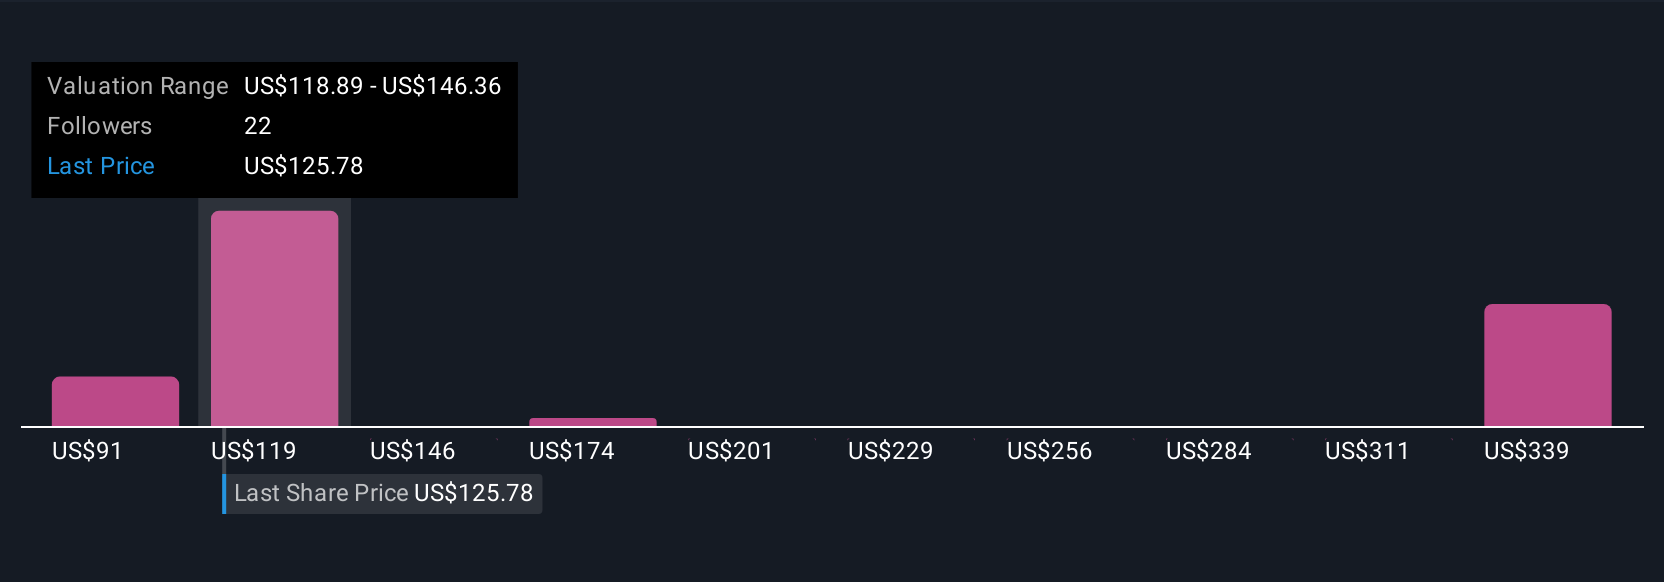
For example, the most optimistic investors on Toll Brothers see strong growth from affluent Millennial and Gen Z buyers driving the price as high as $183 per share. The most cautious believe risks around demand, margin pressure, and speculative builds could mean a fair value closer to $92 per share. By writing your own Narrative and comparing your fair value to the market price, you get a clear, actionable signal on when to buy or sell, all powered by your own reasoning and the latest data.
Do you think there's more to the story for Toll Brothers? Create your own Narrative to let the Community know!
This article by Simply Wall St is general in nature. We provide commentary based on historical data and analyst forecasts only using an unbiased methodology and our articles are not intended to be financial advice. It does not constitute a recommendation to buy or sell any stock, and does not take account of your objectives, or your financial situation. We aim to bring you long-term focused analysis driven by fundamental data. Note that our analysis may not factor in the latest price-sensitive company announcements or qualitative material. Simply Wall St has no position in any stocks mentioned.
Valuation is complex, but we're here to simplify it.
Discover if Toll Brothers might be undervalued or overvalued with our detailed analysis, featuring fair value estimates, potential risks, dividends, insider trades, and its financial condition.
Access Free AnalysisHave feedback on this article? Concerned about the content? Get in touch with us directly. Alternatively, email editorial-team@simplywallst.com
About NYSE:TOL
Toll Brothers
Designs, builds, markets, sells, and arranges finance for a range of detached and attached homes in luxury residential communities in the United States.
Flawless balance sheet and undervalued.
Similar Companies
Market Insights

Advertisement
Community Narratives
A formidable player in AI and enterprise computing.
Fair Value US$210.00|3.1% overvalued
CO
Community Contributor
IREN's Bold Moves in Sustainable Bitcoin Mining & AI Data Centers
Fair Value US$72.52|11.6% undervalued
BL
Community Contributor
Cooling the Champions: The Aussie Tech Behind F1's Victories
Fair Value AU$12.40|40.4% undervalued
TR
Community Contributor