- United States
- /
- Luxury
- /
- NYSE:RL
Ralph Lauren Corporation's (NYSE:RL) Intrinsic Value Is Potentially 34% Above Its Share Price


Key Insights
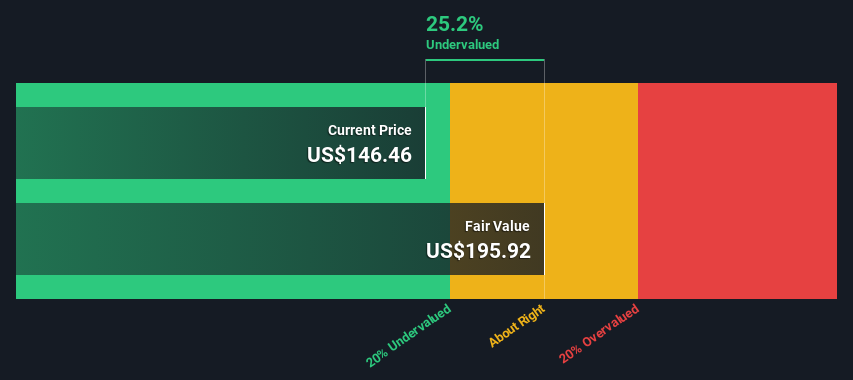
- Ralph Lauren's estimated fair value is US$196 based on 2 Stage Free Cash Flow to Equity
- Ralph Lauren is estimated to be 25% undervalued based on current share price of US$146
- Analyst price target for RL is US$150 which is 23% below our fair value estimate
Does the January share price for Ralph Lauren Corporation (NYSE:RL) reflect what it's really worth? Today, we will estimate the stock's intrinsic value by taking the forecast future cash flows of the company and discounting them back to today's value. We will use the Discounted Cash Flow (DCF) model on this occasion. Before you think you won't be able to understand it, just read on! It's actually much less complex than you'd imagine.
Remember though, that there are many ways to estimate a company's value, and a DCF is just one method. Anyone interested in learning a bit more about intrinsic value should have a read of the Simply Wall St analysis model.
Check out our latest analysis for Ralph Lauren
The Model
We use what is known as a 2-stage model, which simply means we have two different periods of growth rates for the company's cash flows. Generally the first stage is higher growth, and the second stage is a lower growth phase. To begin with, we have to get estimates of the next ten years of cash flows. Where possible we use analyst estimates, but when these aren't available we extrapolate the previous free cash flow (FCF) from the last estimate or reported value. We assume companies with shrinking free cash flow will slow their rate of shrinkage, and that companies with growing free cash flow will see their growth rate slow, over this period. We do this to reflect that growth tends to slow more in the early years than it does in later years.
A DCF is all about the idea that a dollar in the future is less valuable than a dollar today, so we need to discount the sum of these future cash flows to arrive at a present value estimate:
10-year free cash flow (FCF) estimate
| 2024 | 2025 | 2026 | 2027 | 2028 | 2029 | 2030 | 2031 | 2032 | 2033 | |
| Levered FCF ($, Millions) | US$766.6m | US$647.2m | US$785.3m | US$834.2m | US$876.2m | US$912.8m | US$945.6m | US$975.7m | US$1.00b | US$1.03b |
| Growth Rate Estimate Source | Analyst x6 | Analyst x7 | Analyst x3 | Est @ 6.23% | Est @ 5.02% | Est @ 4.18% | Est @ 3.59% | Est @ 3.18% | Est @ 2.89% | Est @ 2.69% |
| Present Value ($, Millions) Discounted @ 8.7% | US$705 | US$548 | US$612 | US$598 | US$578 | US$554 | US$528 | US$502 | US$475 | US$449 |
("Est" = FCF growth rate estimated by Simply Wall St)
Present Value of 10-year Cash Flow (PVCF) = US$5.5b
The second stage is also known as Terminal Value, this is the business's cash flow after the first stage. For a number of reasons a very conservative growth rate is used that cannot exceed that of a country's GDP growth. In this case we have used the 5-year average of the 10-year government bond yield (2.2%) to estimate future growth. In the same way as with the 10-year 'growth' period, we discount future cash flows to today's value, using a cost of equity of 8.7%.
Terminal Value (TV)= FCF2033 × (1 + g) ÷ (r – g) = US$1.0b× (1 + 2.2%) ÷ (8.7%– 2.2%) = US$16b
Present Value of Terminal Value (PVTV)= TV / (1 + r)10= US$16b÷ ( 1 + 8.7%)10= US$7.1b
The total value, or equity value, is then the sum of the present value of the future cash flows, which in this case is US$13b. To get the intrinsic value per share, we divide this by the total number of shares outstanding. Compared to the current share price of US$146, the company appears a touch undervalued at a 25% discount to where the stock price trades currently. Valuations are imprecise instruments though, rather like a telescope - move a few degrees and end up in a different galaxy. Do keep this in mind.
The Assumptions
The calculation above is very dependent on two assumptions. The first is the discount rate and the other is the cash flows. If you don't agree with these result, have a go at the calculation yourself and play with the assumptions. The DCF also does not consider the possible cyclicality of an industry, or a company's future capital requirements, so it does not give a full picture of a company's potential performance. Given that we are looking at Ralph Lauren as potential shareholders, the cost of equity is used as the discount rate, rather than the cost of capital (or weighted average cost of capital, WACC) which accounts for debt. In this calculation we've used 8.7%, which is based on a levered beta of 1.290. Beta is a measure of a stock's volatility, compared to the market as a whole. We get our beta from the industry average beta of globally comparable companies, with an imposed limit between 0.8 and 2.0, which is a reasonable range for a stable business.
SWOT Analysis for Ralph Lauren
- Earnings growth over the past year exceeded the industry.
- Debt is not viewed as a risk.
- Dividends are covered by earnings and cash flows.
- Earnings growth over the past year is below its 5-year average.
- Dividend is low compared to the top 25% of dividend payers in the Luxury market.
- Annual earnings are forecast to grow for the next 3 years.
- Trading below our estimate of fair value by more than 20%.
- Annual earnings are forecast to grow slower than the American market.
Looking Ahead:
Whilst important, the DCF calculation ideally won't be the sole piece of analysis you scrutinize for a company. DCF models are not the be-all and end-all of investment valuation. Instead the best use for a DCF model is to test certain assumptions and theories to see if they would lead to the company being undervalued or overvalued. If a company grows at a different rate, or if its cost of equity or risk free rate changes sharply, the output can look very different. Why is the intrinsic value higher than the current share price? For Ralph Lauren, we've put together three relevant items you should assess:
- Risks: Consider for instance, the ever-present spectre of investment risk. We've identified 2 warning signs with Ralph Lauren , and understanding these should be part of your investment process.
- Management:Have insiders been ramping up their shares to take advantage of the market's sentiment for RL's future outlook? Check out our management and board analysis with insights on CEO compensation and governance factors.
- Other Solid Businesses: Low debt, high returns on equity and good past performance are fundamental to a strong business. Why not explore our interactive list of stocks with solid business fundamentals to see if there are other companies you may not have considered!
PS. Simply Wall St updates its DCF calculation for every American stock every day, so if you want to find the intrinsic value of any other stock just search here.
New: AI Stock Screener & Alerts
Our new AI Stock Screener scans the market every day to uncover opportunities.
• Dividend Powerhouses (3%+ Yield)
• Undervalued Small Caps with Insider Buying
• High growth Tech and AI Companies
Or build your own from over 50 metrics.
Have feedback on this article? Concerned about the content? Get in touch with us directly. Alternatively, email editorial-team (at) simplywallst.com.
This article by Simply Wall St is general in nature. We provide commentary based on historical data and analyst forecasts only using an unbiased methodology and our articles are not intended to be financial advice. It does not constitute a recommendation to buy or sell any stock, and does not take account of your objectives, or your financial situation. We aim to bring you long-term focused analysis driven by fundamental data. Note that our analysis may not factor in the latest price-sensitive company announcements or qualitative material. Simply Wall St has no position in any stocks mentioned.
About NYSE:RL
Ralph Lauren
Designs, markets, and distributes lifestyle products in North America, Europe, Asia, and internationally.
Outstanding track record with excellent balance sheet.
Similar Companies
Market Insights

Community Narratives

