- United States
- /
- Leisure
- /
- NasdaqGS:SWIM
Is Latham Group, Inc. (NASDAQ:SWIM) Expensive For A Reason? A Look At Its Intrinsic Value


Key Insights
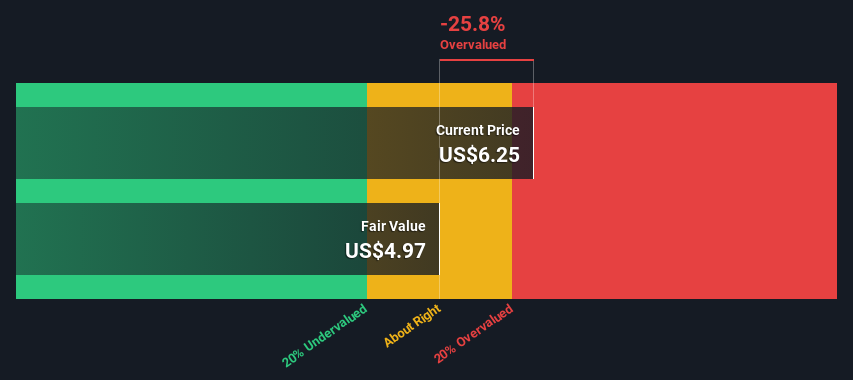
- The projected fair value for Latham Group is US$4.97 based on 2 Stage Free Cash Flow to Equity
- Current share price of US$6.25 suggests Latham Group is potentially 26% overvalued
- Our fair value estimate is similar to Latham Group's analyst price target of US$4.99
In this article we are going to estimate the intrinsic value of Latham Group, Inc. (NASDAQ:SWIM) by taking the forecast future cash flows of the company and discounting them back to today's value. One way to achieve this is by employing the Discounted Cash Flow (DCF) model. Don't get put off by the jargon, the math behind it is actually quite straightforward.
We would caution that there are many ways of valuing a company and, like the DCF, each technique has advantages and disadvantages in certain scenarios. If you want to learn more about discounted cash flow, the rationale behind this calculation can be read in detail in the Simply Wall St analysis model.
See our latest analysis for Latham Group
The Method
We use what is known as a 2-stage model, which simply means we have two different periods of growth rates for the company's cash flows. Generally the first stage is higher growth, and the second stage is a lower growth phase. To start off with, we need to estimate the next ten years of cash flows. Where possible we use analyst estimates, but when these aren't available we extrapolate the previous free cash flow (FCF) from the last estimate or reported value. We assume companies with shrinking free cash flow will slow their rate of shrinkage, and that companies with growing free cash flow will see their growth rate slow, over this period. We do this to reflect that growth tends to slow more in the early years than it does in later years.
A DCF is all about the idea that a dollar in the future is less valuable than a dollar today, and so the sum of these future cash flows is then discounted to today's value:
10-year free cash flow (FCF) forecast
| 2025 | 2026 | 2027 | 2028 | 2029 | 2030 | 2031 | 2032 | 2033 | 2034 | |
| Levered FCF ($, Millions) | US$48.0m | US$40.0m | US$35.9m | US$33.6m | US$32.4m | US$31.8m | US$31.6m | US$31.7m | US$32.1m | US$32.5m |
| Growth Rate Estimate Source | Analyst x1 | Analyst x1 | Est @ -10.17% | Est @ -6.37% | Est @ -3.71% | Est @ -1.84% | Est @ -0.54% | Est @ 0.37% | Est @ 1.01% | Est @ 1.46% |
| Present Value ($, Millions) Discounted @ 7.5% | US$44.7 | US$34.6 | US$29.0 | US$25.2 | US$22.6 | US$20.7 | US$19.1 | US$17.9 | US$16.8 | US$15.8 |
("Est" = FCF growth rate estimated by Simply Wall St)
Present Value of 10-year Cash Flow (PVCF) = US$246m
After calculating the present value of future cash flows in the initial 10-year period, we need to calculate the Terminal Value, which accounts for all future cash flows beyond the first stage. The Gordon Growth formula is used to calculate Terminal Value at a future annual growth rate equal to the 5-year average of the 10-year government bond yield of 2.5%. We discount the terminal cash flows to today's value at a cost of equity of 7.5%.
Terminal Value (TV)= FCF2034 × (1 + g) ÷ (r – g) = US$33m× (1 + 2.5%) ÷ (7.5%– 2.5%) = US$673m
Present Value of Terminal Value (PVTV)= TV / (1 + r)10= US$673m÷ ( 1 + 7.5%)10= US$328m
The total value, or equity value, is then the sum of the present value of the future cash flows, which in this case is US$574m. The last step is to then divide the equity value by the number of shares outstanding. Relative to the current share price of US$6.3, the company appears slightly overvalued at the time of writing. Valuations are imprecise instruments though, rather like a telescope - move a few degrees and end up in a different galaxy. Do keep this in mind.
Important Assumptions
The calculation above is very dependent on two assumptions. The first is the discount rate and the other is the cash flows. If you don't agree with these result, have a go at the calculation yourself and play with the assumptions. The DCF also does not consider the possible cyclicality of an industry, or a company's future capital requirements, so it does not give a full picture of a company's potential performance. Given that we are looking at Latham Group as potential shareholders, the cost of equity is used as the discount rate, rather than the cost of capital (or weighted average cost of capital, WACC) which accounts for debt. In this calculation we've used 7.5%, which is based on a levered beta of 1.203. Beta is a measure of a stock's volatility, compared to the market as a whole. We get our beta from the industry average beta of globally comparable companies, with an imposed limit between 0.8 and 2.0, which is a reasonable range for a stable business.
SWOT Analysis for Latham Group
- Debt is well covered by cash flow.
- Interest payments on debt are not well covered.
- Expensive based on P/E ratio and estimated fair value.
- Annual earnings are forecast to grow for the next 3 years.
- Annual earnings are forecast to grow slower than the American market.
Next Steps:
Whilst important, the DCF calculation is only one of many factors that you need to assess for a company. It's not possible to obtain a foolproof valuation with a DCF model. Instead the best use for a DCF model is to test certain assumptions and theories to see if they would lead to the company being undervalued or overvalued. For example, changes in the company's cost of equity or the risk free rate can significantly impact the valuation. What is the reason for the share price exceeding the intrinsic value? For Latham Group, there are three important elements you should further research:
- Risks: You should be aware of the 3 warning signs for Latham Group (2 shouldn't be ignored!) we've uncovered before considering an investment in the company.
- Future Earnings: How does SWIM's growth rate compare to its peers and the wider market? Dig deeper into the analyst consensus number for the upcoming years by interacting with our free analyst growth expectation chart.
- Other High Quality Alternatives: Do you like a good all-rounder? Explore our interactive list of high quality stocks to get an idea of what else is out there you may be missing!
PS. Simply Wall St updates its DCF calculation for every American stock every day, so if you want to find the intrinsic value of any other stock just search here.
New: AI Stock Screener & Alerts
Our new AI Stock Screener scans the market every day to uncover opportunities.
• Dividend Powerhouses (3%+ Yield)
• Undervalued Small Caps with Insider Buying
• High growth Tech and AI Companies
Or build your own from over 50 metrics.
Have feedback on this article? Concerned about the content? Get in touch with us directly. Alternatively, email editorial-team (at) simplywallst.com.
This article by Simply Wall St is general in nature. We provide commentary based on historical data and analyst forecasts only using an unbiased methodology and our articles are not intended to be financial advice. It does not constitute a recommendation to buy or sell any stock, and does not take account of your objectives, or your financial situation. We aim to bring you long-term focused analysis driven by fundamental data. Note that our analysis may not factor in the latest price-sensitive company announcements or qualitative material. Simply Wall St has no position in any stocks mentioned.
About NasdaqGS:SWIM
Latham Group
Designs, manufactures, and markets in-ground residential swimming pools in North America, Australia, and New Zealand.
Adequate balance sheet with moderate growth potential.
Market Insights

Community Narratives
