Advertisement
- United States
- /
- Trade Distributors
- /
- NasdaqGS:RUSH.A
Evaluating Rush Enterprises Shares After Recent 14% Slide and Truck Market Uncertainty

Simply Wall St
Reviewed by Bailey Pemberton
If you have been watching Rush Enterprises, you may be asking yourself whether now is the moment to buy, hold, or move on. The stock price has slipped by 7.3% in the past week and it is down more than 14% over the last month. Year to date, shares have shed 8.8%. On a longer horizon, however, Rush Enterprises has quietly put together an impressive run, climbing 70.8% over three years and more than doubling investors’ money over five years with a 114.6% gain. That kind of return turns heads, but so do the recent bumps, especially as shifting dynamics in the truck dealership market and economic sentiment have kept investors on their toes.
With the stock now trading at $49.99, speculation is swirling about whether these price drops reflect a real change for Rush or simply present an attractive entry point. One way analysts try to settle this question is by turning to valuation checks such as yardsticks that look at things like the company’s price compared to its earnings, sales, book value, and so on. Rush Enterprises currently scores a strong 5 out of 6 on a common valuation scale, meaning it looks undervalued on five different measures. So, is Wall Street underestimating Rush?
That is exactly what we are going to dig into next. We will look at each valuation method and explore what it reveals. Stay tuned, because at the end, I will share an even better way to decide if Rush is a true bargain or a value trap in disguise.
Why Rush Enterprises is lagging behind its peers
Approach 1: Rush Enterprises Discounted Cash Flow (DCF) Analysis
The Discounted Cash Flow (DCF) model estimates a company’s value by projecting its future cash flows and discounting them back to their value today. This approach helps investors figure out what a business might be worth if you rely solely on the money it generates, rather than factors like current stock sentiment.
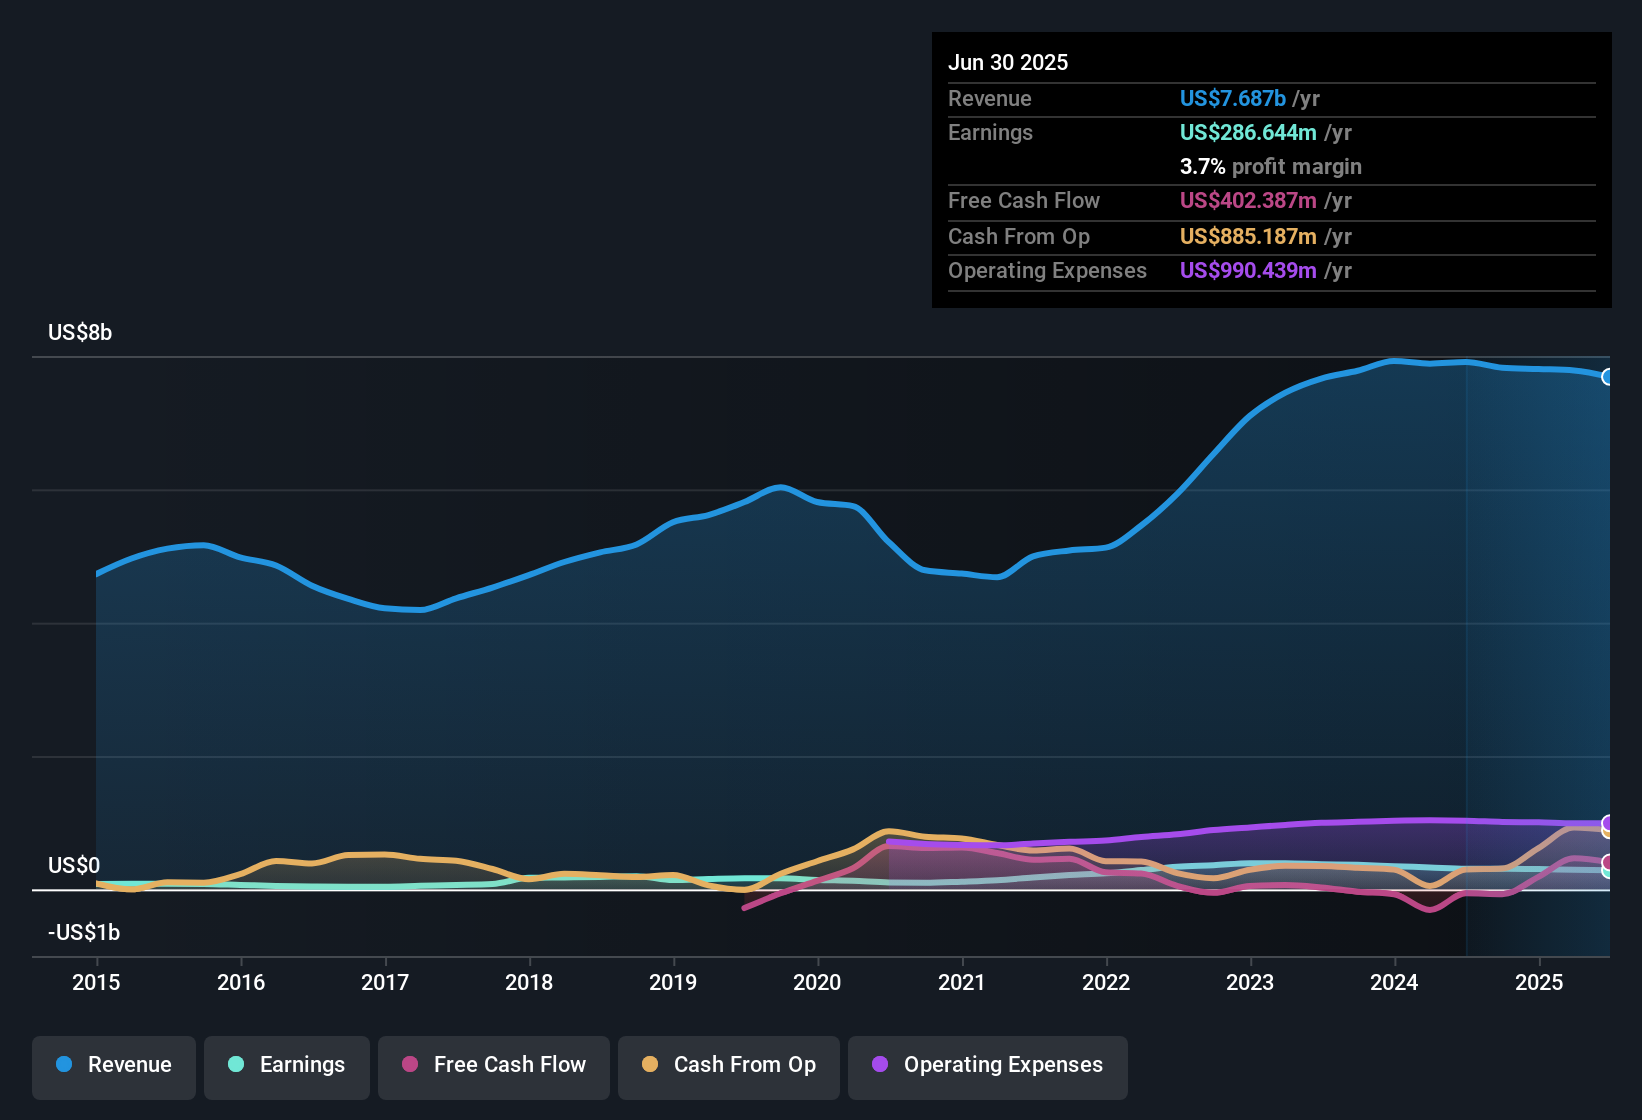
For Rush Enterprises, the latest available Free Cash Flow stands at $501.8 million. Analysts and modelers use these figures as a base, then project forward. While precise analyst forecasts usually go out just five years, the model here extrapolates ten years into the future. By 2035, projected free cash flow reaches an estimated $6.3 billion, with discounted values reflecting steady growth and conservative assumptions along the way.
When these projected cash flows are added up and discounted back to today in USD, the model calculates an intrinsic value of $893.62 per share. With the current share price at $49.99, this points to the stock trading at a steep 94.4% discount to its DCF-based fair value. This implies significant undervaluation relative to projected cash generation.
Result: UNDERVALUED
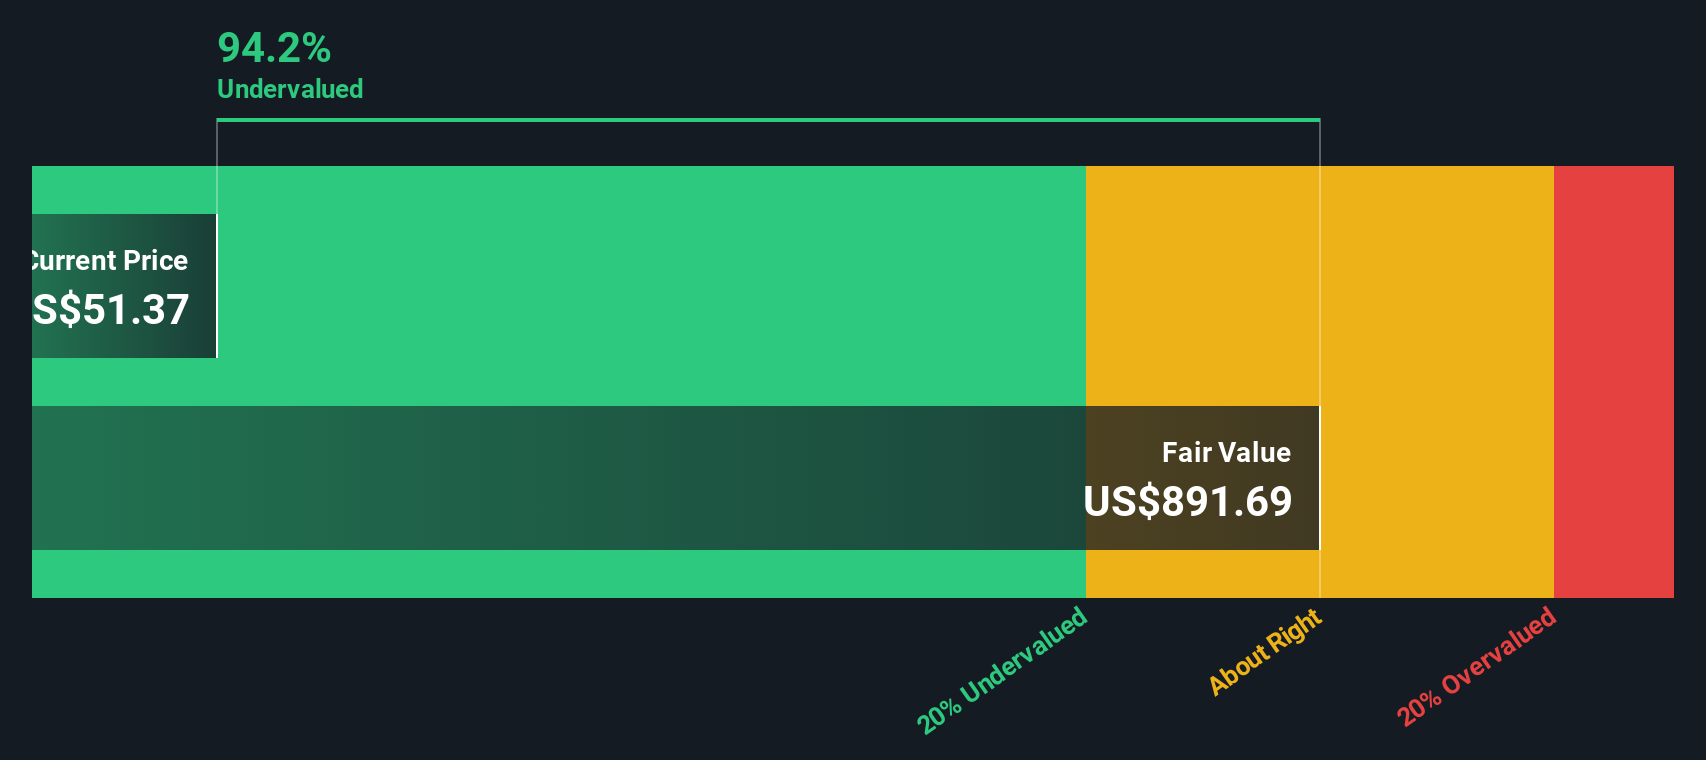
Our Discounted Cash Flow (DCF) analysis suggests Rush Enterprises is undervalued by 94.4%. Track this in your watchlist or portfolio, or discover more undervalued stocks.
Approach 2: Rush Enterprises Price vs Earnings
The Price-to-Earnings (PE) ratio is a widely used valuation metric for profitable companies, as it lets investors compare how much they are paying for each dollar of a company’s earnings. For established, profit-generating businesses like Rush Enterprises, the PE ratio provides a quick picture of cost versus earnings potential.
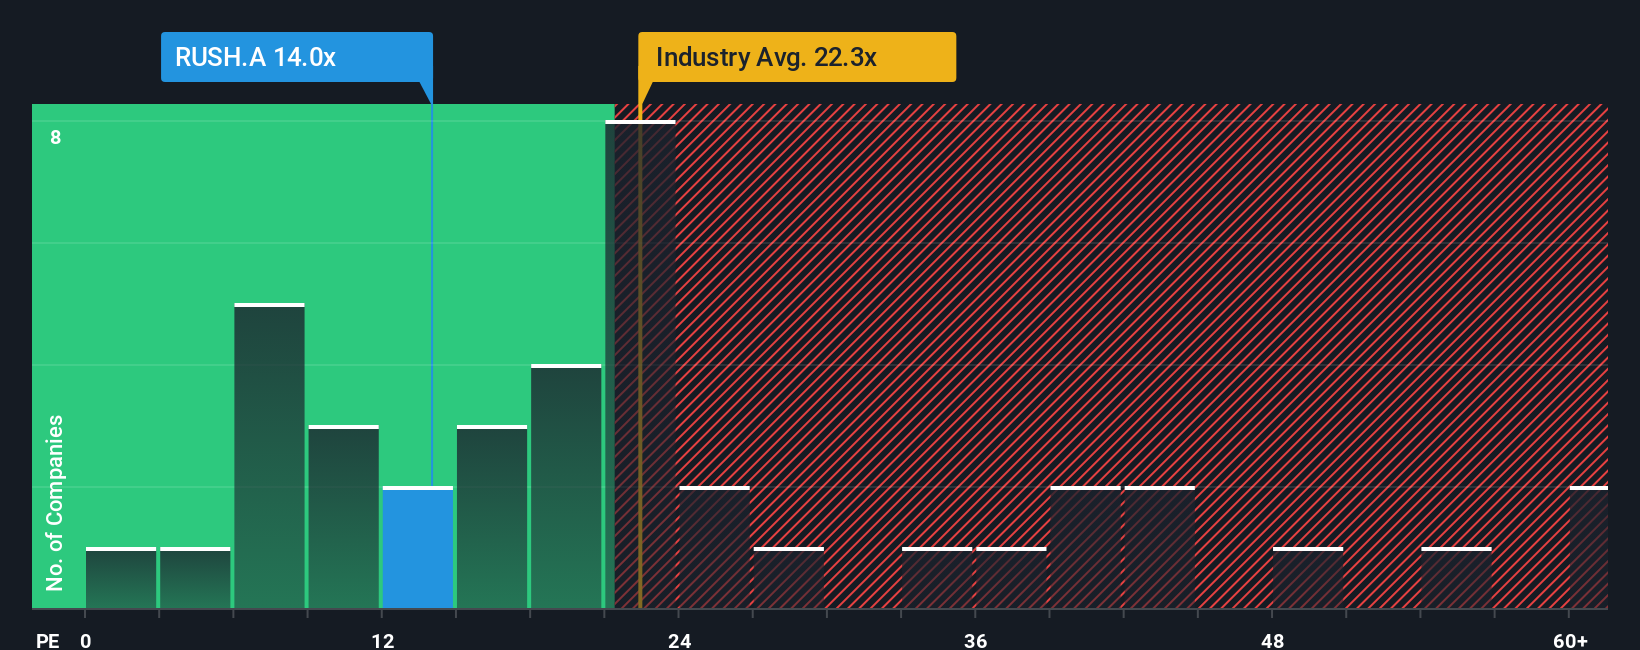
However, a “normal” or fair PE ratio is not just about current profits. Higher growth expectations can justify higher PE ratios, while more risk or slower growth warrants a lower number. That means the right benchmark varies depending on the situation. Looking at Rush Enterprises, the company currently has a PE ratio of 13.6x. For context, the Trade Distributors industry average is 22.4x, and the company's direct peers average an even higher 68.2x.
While these benchmarks are helpful, Simply Wall St’s proprietary “Fair Ratio” goes further. This measure weighs not just simple comparisons but also factors such as Rush’s earnings growth outlook, risk profile, profit margins, market cap, and industry characteristics. For Rush Enterprises, the Fair Ratio comes in at 21.5x. Because it is tuned to the company’s unique situation, this ratio provides a more accurate sense of what investors might consider paying today.
Comparing Rush’s current PE of 13.6x with the Fair Ratio of 21.5x, the shares appear comfortably undervalued by this measure as well.
Result: UNDERVALUED
PE ratios tell one story, but what if the real opportunity lies elsewhere? Discover companies where insiders are betting big on explosive growth.
Upgrade Your Decision Making: Choose your Rush Enterprises Narrative
Earlier, we mentioned there is an even better way to understand valuation, so let’s introduce you to Narratives. A Narrative is your personal investment story; it’s how you connect what’s happening with Rush Enterprises, and your expectations for its future, to a financial forecast and ultimately a fair value. Rather than relying on just the numbers, Narratives empower you to lay out what you believe about Rush’s prospects, plug in your own estimates for future revenue, profit margins or industry trends, and see how those beliefs would impact the company’s intrinsic worth.
Think of Narratives as an accessible tool on Simply Wall St’s Community page, available to millions of investors. Narratives help you make confident buy or sell decisions by visually comparing your Fair Value to the current share price, so you know whether the stock is cheap, expensive, or fairly valued based on your story. Best of all, Narratives are kept up to date in real time, and if news or earnings reports shift the outlook, your Narrative adjusts automatically.
For example, one investor might see Rush as a steady winner if high-margin service revenues keep growing, while another might worry that tougher regulations and weaker freight volumes could hold it back. Narratives let you make these perspectives concrete and actionable with real numbers and clear comparisons.
Do you think there's more to the story for Rush Enterprises? Create your own Narrative to let the Community know!
This article by Simply Wall St is general in nature. We provide commentary based on historical data and analyst forecasts only using an unbiased methodology and our articles are not intended to be financial advice. It does not constitute a recommendation to buy or sell any stock, and does not take account of your objectives, or your financial situation. We aim to bring you long-term focused analysis driven by fundamental data. Note that our analysis may not factor in the latest price-sensitive company announcements or qualitative material. Simply Wall St has no position in any stocks mentioned.
New: AI Stock Screener & Alerts
Our new AI Stock Screener scans the market every day to uncover opportunities.
• Dividend Powerhouses (3%+ Yield)
• Undervalued Small Caps with Insider Buying
• High growth Tech and AI Companies
Or build your own from over 50 metrics.
Have feedback on this article? Concerned about the content? Get in touch with us directly. Alternatively, email editorial-team@simplywallst.com
About NasdaqGS:RUSH.A
Rush Enterprises
Through its subsidiaries, operates as an integrated retailer of commercial vehicles and related services in the United States and Canada.
Undervalued with excellent balance sheet.
Similar Companies
Market Insights

Advertisement
Community Narratives
The Next Phase of Energy Storage: How NeoVolta Is Tackling America’s Power Crunch
Fair Value US$7.50|30.4% undervalued
MA
Community Contributor
A formidable player in AI and enterprise computing.
Fair Value US$210.00|3.0% undervalued
CO
Community Contributor
IREN's Bold Moves in Sustainable Bitcoin Mining & AI Data Centers
Fair Value US$72.52|20.4% undervalued
BL
Community Contributor
Cooling the Champions: The Aussie Tech Behind F1's Victories
Fair Value AU$12.40|38.1% undervalued
TR
Community Contributor