- United States
- /
- Banks
- /
- NasdaqGS:NBTB
Investing in NBT Bancorp (NASDAQ:NBTB) a year ago would have delivered you a 29% gain


These days it's easy to simply buy an index fund, and your returns should (roughly) match the market. But one can do better than that by picking better than average stocks (as part of a diversified portfolio). For example, the NBT Bancorp Inc. (NASDAQ:NBTB) share price is up 25% in the last 1 year, clearly besting the market decline of around 15% (not including dividends). So that should have shareholders smiling. However, the longer term returns haven't been so impressive, with the stock up just 16% in the last three years.
Let's take a look at the underlying fundamentals over the longer term, and see if they've been consistent with shareholders returns.
Check out the opportunities and risks within the US Banks industry.
While the efficient markets hypothesis continues to be taught by some, it has been proven that markets are over-reactive dynamic systems, and investors are not always rational. By comparing earnings per share (EPS) and share price changes over time, we can get a feel for how investor attitudes to a company have morphed over time.
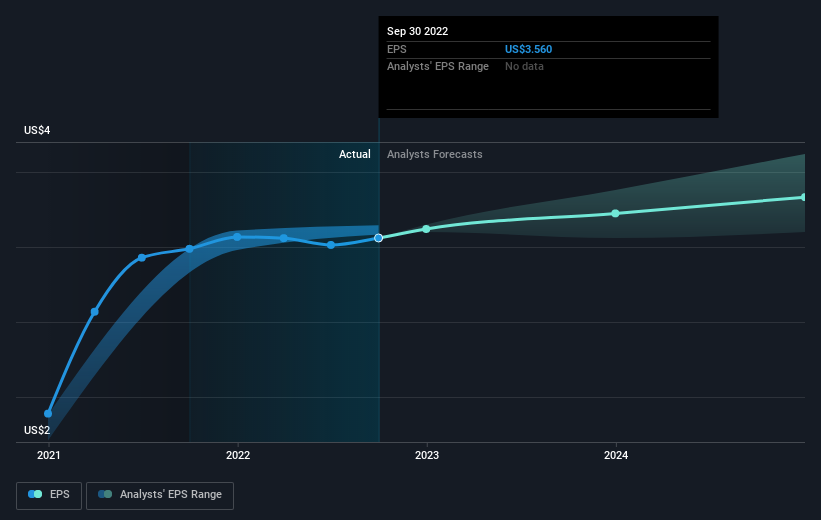
During the last year NBT Bancorp grew its earnings per share (EPS) by 2.1%. The share price gain of 25% certainly outpaced the EPS growth. So it's fair to assume the market has a higher opinion of the business than it a year ago.
The graphic below depicts how EPS has changed over time (unveil the exact values by clicking on the image).
We consider it positive that insiders have made significant purchases in the last year. Having said that, most people consider earnings and revenue growth trends to be a more meaningful guide to the business. Dive deeper into the earnings by checking this interactive graph of NBT Bancorp's earnings, revenue and cash flow.
What About Dividends?
It is important to consider the total shareholder return, as well as the share price return, for any given stock. Whereas the share price return only reflects the change in the share price, the TSR includes the value of dividends (assuming they were reinvested) and the benefit of any discounted capital raising or spin-off. It's fair to say that the TSR gives a more complete picture for stocks that pay a dividend. As it happens, NBT Bancorp's TSR for the last 1 year was 29%, which exceeds the share price return mentioned earlier. The dividends paid by the company have thusly boosted the total shareholder return.
A Different Perspective
It's good to see that NBT Bancorp has rewarded shareholders with a total shareholder return of 29% in the last twelve months. Of course, that includes the dividend. That's better than the annualised return of 7% over half a decade, implying that the company is doing better recently. In the best case scenario, this may hint at some real business momentum, implying that now could be a great time to delve deeper. Investors who like to make money usually check up on insider purchases, such as the price paid, and total amount bought. You can find out about the insider purchases of NBT Bancorp by clicking this link.
NBT Bancorp is not the only stock that insiders are buying. For those who like to find winning investments this free list of growing companies with recent insider purchasing, could be just the ticket.
Please note, the market returns quoted in this article reflect the market weighted average returns of stocks that currently trade on US exchanges.
Valuation is complex, but we're here to simplify it.
Discover if NBT Bancorp might be undervalued or overvalued with our detailed analysis, featuring fair value estimates, potential risks, dividends, insider trades, and its financial condition.
Access Free AnalysisHave feedback on this article? Concerned about the content? Get in touch with us directly. Alternatively, email editorial-team (at) simplywallst.com.
This article by Simply Wall St is general in nature. We provide commentary based on historical data and analyst forecasts only using an unbiased methodology and our articles are not intended to be financial advice. It does not constitute a recommendation to buy or sell any stock, and does not take account of your objectives, or your financial situation. We aim to bring you long-term focused analysis driven by fundamental data. Note that our analysis may not factor in the latest price-sensitive company announcements or qualitative material. Simply Wall St has no position in any stocks mentioned.
About NasdaqGS:NBTB
NBT Bancorp
A financial holding company, provides commercial banking, retail banking, and wealth management services.
Flawless balance sheet with solid track record and pays a dividend.
Similar Companies
Market Insights

Community Narratives

