
Advertisement
- United States
- /
- Auto
- /
- NYSE:NIO
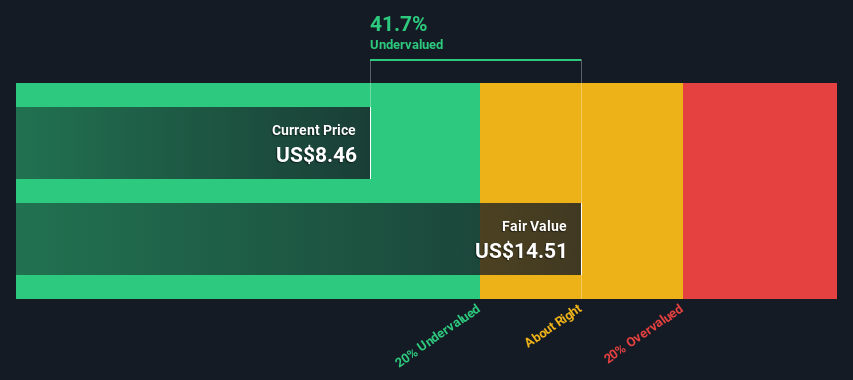
NIO Inc. (NYSE:NIO) Shares Could Be 42% Below Their Intrinsic Value Estimate

Key Insights
- NIO's estimated fair value is US$14.51 based on 2 Stage Free Cash Flow to Equity
- NIO's US$8.46 share price signals that it might be 42% undervalued
- Analyst price target for NIO is CN¥13.50 which is 6.9% below our fair value estimate
Today we'll do a simple run through of a valuation method used to estimate the attractiveness of NIO Inc. (NYSE:NIO) as an investment opportunity by estimating the company's future cash flows and discounting them to their present value. Our analysis will employ the Discounted Cash Flow (DCF) model. Before you think you won't be able to understand it, just read on! It's actually much less complex than you'd imagine.
Companies can be valued in a lot of ways, so we would point out that a DCF is not perfect for every situation. Anyone interested in learning a bit more about intrinsic value should have a read of the Simply Wall St analysis model.
See our latest analysis for NIO
The Model
We're using the 2-stage growth model, which simply means we take in account two stages of company's growth. In the initial period the company may have a higher growth rate and the second stage is usually assumed to have a stable growth rate. To start off with, we need to estimate the next ten years of cash flows. Where possible we use analyst estimates, but when these aren't available we extrapolate the previous free cash flow (FCF) from the last estimate or reported value. We assume companies with shrinking free cash flow will slow their rate of shrinkage, and that companies with growing free cash flow will see their growth rate slow, over this period. We do this to reflect that growth tends to slow more in the early years than it does in later years.
A DCF is all about the idea that a dollar in the future is less valuable than a dollar today, so we discount the value of these future cash flows to their estimated value in today's dollars:
10-year free cash flow (FCF) estimate
| 2024 | 2025 | 2026 | 2027 | 2028 | 2029 | 2030 | 2031 | 2032 | 2033 | |
| Levered FCF (CN¥, Millions) | -CN¥8.71b | -CN¥3.54b | CN¥1.43b | CN¥7.49b | CN¥12.8b | CN¥19.4b | CN¥26.4b | CN¥33.2b | CN¥39.4b | CN¥44.9b |
| Growth Rate Estimate Source | Analyst x8 | Analyst x8 | Analyst x2 | Analyst x1 | Est @ 71.55% | Est @ 50.73% | Est @ 36.16% | Est @ 25.96% | Est @ 18.81% | Est @ 13.81% |
| Present Value (CN¥, Millions) Discounted @ 13% | -CN¥7.7k | -CN¥2.8k | CN¥993 | CN¥4.6k | CN¥7.0k | CN¥9.3k | CN¥11.3k | CN¥12.6k | CN¥13.2k | CN¥13.3k |
("Est" = FCF growth rate estimated by Simply Wall St)
Present Value of 10-year Cash Flow (PVCF) = CN¥62b
After calculating the present value of future cash flows in the initial 10-year period, we need to calculate the Terminal Value, which accounts for all future cash flows beyond the first stage. For a number of reasons a very conservative growth rate is used that cannot exceed that of a country's GDP growth. In this case we have used the 5-year average of the 10-year government bond yield (2.2%) to estimate future growth. In the same way as with the 10-year 'growth' period, we discount future cash flows to today's value, using a cost of equity of 13%.
Terminal Value (TV)= FCF2033 × (1 + g) ÷ (r – g) = CN¥45b× (1 + 2.2%) ÷ (13%– 2.2%) = CN¥426b
Present Value of Terminal Value (PVTV)= TV / (1 + r)10= CN¥426b÷ ( 1 + 13%)10= CN¥127b
The total value is the sum of cash flows for the next ten years plus the discounted terminal value, which results in the Total Equity Value, which in this case is CN¥189b. In the final step we divide the equity value by the number of shares outstanding. Compared to the current share price of US$8.5, the company appears quite undervalued at a 42% discount to where the stock price trades currently. Valuations are imprecise instruments though, rather like a telescope - move a few degrees and end up in a different galaxy. Do keep this in mind.
The Assumptions
Now the most important inputs to a discounted cash flow are the discount rate, and of course, the actual cash flows. If you don't agree with these result, have a go at the calculation yourself and play with the assumptions. The DCF also does not consider the possible cyclicality of an industry, or a company's future capital requirements, so it does not give a full picture of a company's potential performance. Given that we are looking at NIO as potential shareholders, the cost of equity is used as the discount rate, rather than the cost of capital (or weighted average cost of capital, WACC) which accounts for debt. In this calculation we've used 13%, which is based on a levered beta of 1.771. Beta is a measure of a stock's volatility, compared to the market as a whole. We get our beta from the industry average beta of globally comparable companies, with an imposed limit between 0.8 and 2.0, which is a reasonable range for a stable business.
SWOT Analysis for NIO
Strength
- Debt is well covered by earnings.
Weakness
- Shareholders have been diluted in the past year.
Opportunity
- Forecast to reduce losses next year.
- Trading below our estimate of fair value by more than 20%.
Threat
- Debt is not well covered by operating cash flow.
- Has less than 3 years of cash runway based on current free cash flow.
- Not expected to become profitable over the next 3 years.
Moving On:
Whilst important, the DCF calculation shouldn't be the only metric you look at when researching a company. It's not possible to obtain a foolproof valuation with a DCF model. Preferably you'd apply different cases and assumptions and see how they would impact the company's valuation. For instance, if the terminal value growth rate is adjusted slightly, it can dramatically alter the overall result. Why is the intrinsic value higher than the current share price? For NIO, we've put together three relevant elements you should assess:
- Risks: For example, we've discovered 3 warning signs for NIO that you should be aware of before investing here.
- Future Earnings: How does NIO's growth rate compare to its peers and the wider market? Dig deeper into the analyst consensus number for the upcoming years by interacting with our free analyst growth expectation chart.
- Other Solid Businesses: Low debt, high returns on equity and good past performance are fundamental to a strong business. Why not explore our interactive list of stocks with solid business fundamentals to see if there are other companies you may not have considered!
PS. Simply Wall St updates its DCF calculation for every American stock every day, so if you want to find the intrinsic value of any other stock just search here.
Valuation is complex, but we're here to simplify it.
Discover if NIO might be undervalued or overvalued with our detailed analysis, featuring fair value estimates, potential risks, dividends, insider trades, and its financial condition.
Access Free AnalysisHave feedback on this article? Concerned about the content? Get in touch with us directly. Alternatively, email editorial-team (at) simplywallst.com.
This article by Simply Wall St is general in nature. We provide commentary based on historical data and analyst forecasts only using an unbiased methodology and our articles are not intended to be financial advice. It does not constitute a recommendation to buy or sell any stock, and does not take account of your objectives, or your financial situation. We aim to bring you long-term focused analysis driven by fundamental data. Note that our analysis may not factor in the latest price-sensitive company announcements or qualitative material. Simply Wall St has no position in any stocks mentioned.
About NYSE:NIO
NIO
Designs, develops, manufactures, and sells smart electric vehicles in China, Europe, and internationally.
Adequate balance sheet and fair value.
Similar Companies
Market Insights


Advertisement
Community Narratives
Pole position to benefit from GENIUS Act
Fair Value US$233.04|58.8% undervalued
CH
Community Contributor
IREN will transform from bitcoin miner to leader in AI infrastructure
Fair Value US$21.48|17.5% undervalued
KA
Community Contributor
Behind the Assay: XRF Scientific’s Role in Modern Mining Economics
Fair Value AU$2.10|2.4% undervalued
RO
Community Contributor