
Advertisement

Key Insights
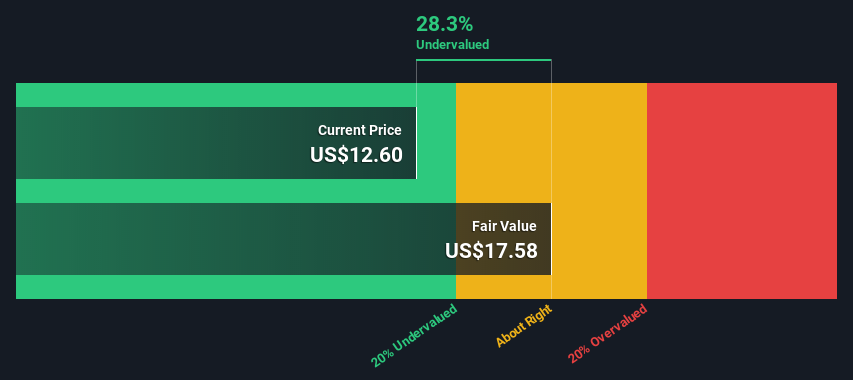
- The projected fair value for Ford Motor is US$17.58 based on 2 Stage Free Cash Flow to Equity
- Ford Motor's US$12.60 share price signals that it might be 28% undervalued
- Analyst price target for F is US$14.14 which is 20% below our fair value estimate
Today we will run through one way of estimating the intrinsic value of Ford Motor Company (NYSE:F) by projecting its future cash flows and then discounting them to today's value. Our analysis will employ the Discounted Cash Flow (DCF) model. Believe it or not, it's not too difficult to follow, as you'll see from our example!
Remember though, that there are many ways to estimate a company's value, and a DCF is just one method. For those who are keen learners of equity analysis, the Simply Wall St analysis model here may be something of interest to you.
View our latest analysis for Ford Motor
What's The Estimated Valuation?
We're using the 2-stage growth model, which simply means we take in account two stages of company's growth. In the initial period the company may have a higher growth rate and the second stage is usually assumed to have a stable growth rate. In the first stage we need to estimate the cash flows to the business over the next ten years. Where possible we use analyst estimates, but when these aren't available we extrapolate the previous free cash flow (FCF) from the last estimate or reported value. We assume companies with shrinking free cash flow will slow their rate of shrinkage, and that companies with growing free cash flow will see their growth rate slow, over this period. We do this to reflect that growth tends to slow more in the early years than it does in later years.
Generally we assume that a dollar today is more valuable than a dollar in the future, and so the sum of these future cash flows is then discounted to today's value:
10-year free cash flow (FCF) forecast
| 2023 | 2024 | 2025 | 2026 | 2027 | 2028 | 2029 | 2030 | 2031 | 2032 | |
| Levered FCF ($, Millions) | US$4.47b | US$2.49b | US$3.95b | US$6.49b | US$8.44b | US$9.92b | US$11.2b | US$12.3b | US$13.2b | US$13.9b |
| Growth Rate Estimate Source | Analyst x5 | Analyst x4 | Analyst x3 | Analyst x1 | Analyst x1 | Est @ 17.46% | Est @ 12.84% | Est @ 9.61% | Est @ 7.35% | Est @ 5.76% |
| Present Value ($, Millions) Discounted @ 14% | US$3.9k | US$1.9k | US$2.7k | US$3.8k | US$4.4k | US$4.5k | US$4.5k | US$4.3k | US$4.1k | US$3.8k |
("Est" = FCF growth rate estimated by Simply Wall St)
Present Value of 10-year Cash Flow (PVCF) = US$38b
After calculating the present value of future cash flows in the initial 10-year period, we need to calculate the Terminal Value, which accounts for all future cash flows beyond the first stage. For a number of reasons a very conservative growth rate is used that cannot exceed that of a country's GDP growth. In this case we have used the 5-year average of the 10-year government bond yield (2.1%) to estimate future growth. In the same way as with the 10-year 'growth' period, we discount future cash flows to today's value, using a cost of equity of 14%.
Terminal Value (TV)= FCF2032 × (1 + g) ÷ (r – g) = US$14b× (1 + 2.1%) ÷ (14%– 2.1%) = US$120b
Present Value of Terminal Value (PVTV)= TV / (1 + r)10= US$120b÷ ( 1 + 14%)10= US$32b
The total value, or equity value, is then the sum of the present value of the future cash flows, which in this case is US$70b. The last step is to then divide the equity value by the number of shares outstanding. Compared to the current share price of US$12.6, the company appears a touch undervalued at a 28% discount to where the stock price trades currently. The assumptions in any calculation have a big impact on the valuation, so it is better to view this as a rough estimate, not precise down to the last cent.
The Assumptions
The calculation above is very dependent on two assumptions. The first is the discount rate and the other is the cash flows. If you don't agree with these result, have a go at the calculation yourself and play with the assumptions. The DCF also does not consider the possible cyclicality of an industry, or a company's future capital requirements, so it does not give a full picture of a company's potential performance. Given that we are looking at Ford Motor as potential shareholders, the cost of equity is used as the discount rate, rather than the cost of capital (or weighted average cost of capital, WACC) which accounts for debt. In this calculation we've used 14%, which is based on a levered beta of 2.000. Beta is a measure of a stock's volatility, compared to the market as a whole. We get our beta from the industry average beta of globally comparable companies, with an imposed limit between 0.8 and 2.0, which is a reasonable range for a stable business.
SWOT Analysis for Ford Motor
Strength
- Debt is well covered by earnings.
Weakness
- Dividend is low compared to the top 25% of dividend payers in the Auto market.
Opportunity
- Expected to breakeven next year.
- Has sufficient cash runway for more than 3 years based on current free cash flows.
- Good value based on P/S ratio and estimated fair value.
Threat
- Debt is not well covered by operating cash flow.
- Paying a dividend but company is unprofitable.
Looking Ahead:
Whilst important, the DCF calculation shouldn't be the only metric you look at when researching a company. DCF models are not the be-all and end-all of investment valuation. Instead the best use for a DCF model is to test certain assumptions and theories to see if they would lead to the company being undervalued or overvalued. For example, changes in the company's cost of equity or the risk free rate can significantly impact the valuation. Can we work out why the company is trading at a discount to intrinsic value? For Ford Motor, we've put together three further aspects you should assess:
- Risks: For example, we've discovered 2 warning signs for Ford Motor that you should be aware of before investing here.
- Future Earnings: How does F's growth rate compare to its peers and the wider market? Dig deeper into the analyst consensus number for the upcoming years by interacting with our free analyst growth expectation chart.
- Other High Quality Alternatives: Do you like a good all-rounder? Explore our interactive list of high quality stocks to get an idea of what else is out there you may be missing!
PS. The Simply Wall St app conducts a discounted cash flow valuation for every stock on the NYSE every day. If you want to find the calculation for other stocks just search here.
New: AI Stock Screener & Alerts
Our new AI Stock Screener scans the market every day to uncover opportunities.
• Dividend Powerhouses (3%+ Yield)
• Undervalued Small Caps with Insider Buying
• High growth Tech and AI Companies
Or build your own from over 50 metrics.
Have feedback on this article? Concerned about the content? Get in touch with us directly. Alternatively, email editorial-team (at) simplywallst.com.
This article by Simply Wall St is general in nature. We provide commentary based on historical data and analyst forecasts only using an unbiased methodology and our articles are not intended to be financial advice. It does not constitute a recommendation to buy or sell any stock, and does not take account of your objectives, or your financial situation. We aim to bring you long-term focused analysis driven by fundamental data. Note that our analysis may not factor in the latest price-sensitive company announcements or qualitative material. Simply Wall St has no position in any stocks mentioned.
About NYSE:F
Ford Motor
Develops, delivers, and services Ford trucks, sport utility vehicles, commercial vans and cars, and Lincoln luxury vehicles worldwide.
Undervalued with solid track record and pays a dividend.
Similar Companies
Market Insights

Advertisement
Community Narratives
Pinterest will surge as advertising innovations ignite revenue growth
Fair Value US$42.63|26.3% undervalued
BR
Community Contributor
Brambles' Revenue Set to Climb 14% with Profit Margins Following
Fair Value AU$21.90|4.9% overvalued
RO
Community Contributor
Challenging Future for STG as Organic Sales Decline by 8.8%
Fair Value DKK 116.13|26.8% undervalued
KA
Community Contributor