- United States
- /
- Auto
- /
- NasdaqGS:RIVN
Is Now the Right Time to Reassess Rivian After R2 Door Handle Redesign?

Reviewed by Bailey Pemberton
If you have been watching Rivian Automotive stock and feeling torn about whether it is time to buy, sell, or simply sit tight, you are not alone. After a year marked by major swings, Rivian’s share price closed most recently at $12.80, up an eye-catching 21.9% over the past twelve months. However, when looking at a longer timeframe, the ride has been bumpy, with the stock still down more than 55% over the past three years. The past week and month have also seen the share price trend lower, with 7-day and 30-day returns landing at -6.2% and -4.9% respectively.
Markets have been digesting the broader slowdown in the electric vehicle market, particularly as federal tax credits disappear and sales forecasts soften. Investors are also keeping a close watch on company-specific developments. In recent weeks, Rivian’s decision to redesign door handles on its R2 model in response to safety concerns has generated headlines. Additionally, Senator Moreno’s news that U.S. auto tariffs could get some relief under the next administration has attracted attention. Although these updates point to operational improvements and potential shifts in risk on the horizon, the immediate market reaction has been cautious.
How does Rivian stack up from a valuation perspective right now? According to our model, Rivian is undervalued in zero of six key valuation checks, which gives it a valuation score of just 0. Of course, valuation is never just about a single score or even a handful of standard measures. Next, we will step through how experts typically assess a stock’s value. And stay tuned, because there is a smarter approach to valuation waiting at the end.
Rivian Automotive scores just 0/6 on our valuation checks. See what other red flags we found in the full valuation breakdown.
Approach 1: Rivian Automotive Discounted Cash Flow (DCF) Analysis
The Discounted Cash Flow (DCF) model estimates a company's intrinsic value by projecting its future cash flows and discounting them back to today's value. This approach combines analyst forecasts for the next few years with longer-term estimates to build a complete picture of expected growth.
For Rivian Automotive, the most recent twelve-month free cash flow stands at negative $1.21 billion, meaning the company is currently operating with negative cash flow. Analyst estimates suggest continued improvements, with free cash flow reaching $961 million by 2029. Projections extend even further, indicating potential free cash flow climbing to about $3.71 billion by 2035, as calculated by extrapolation.
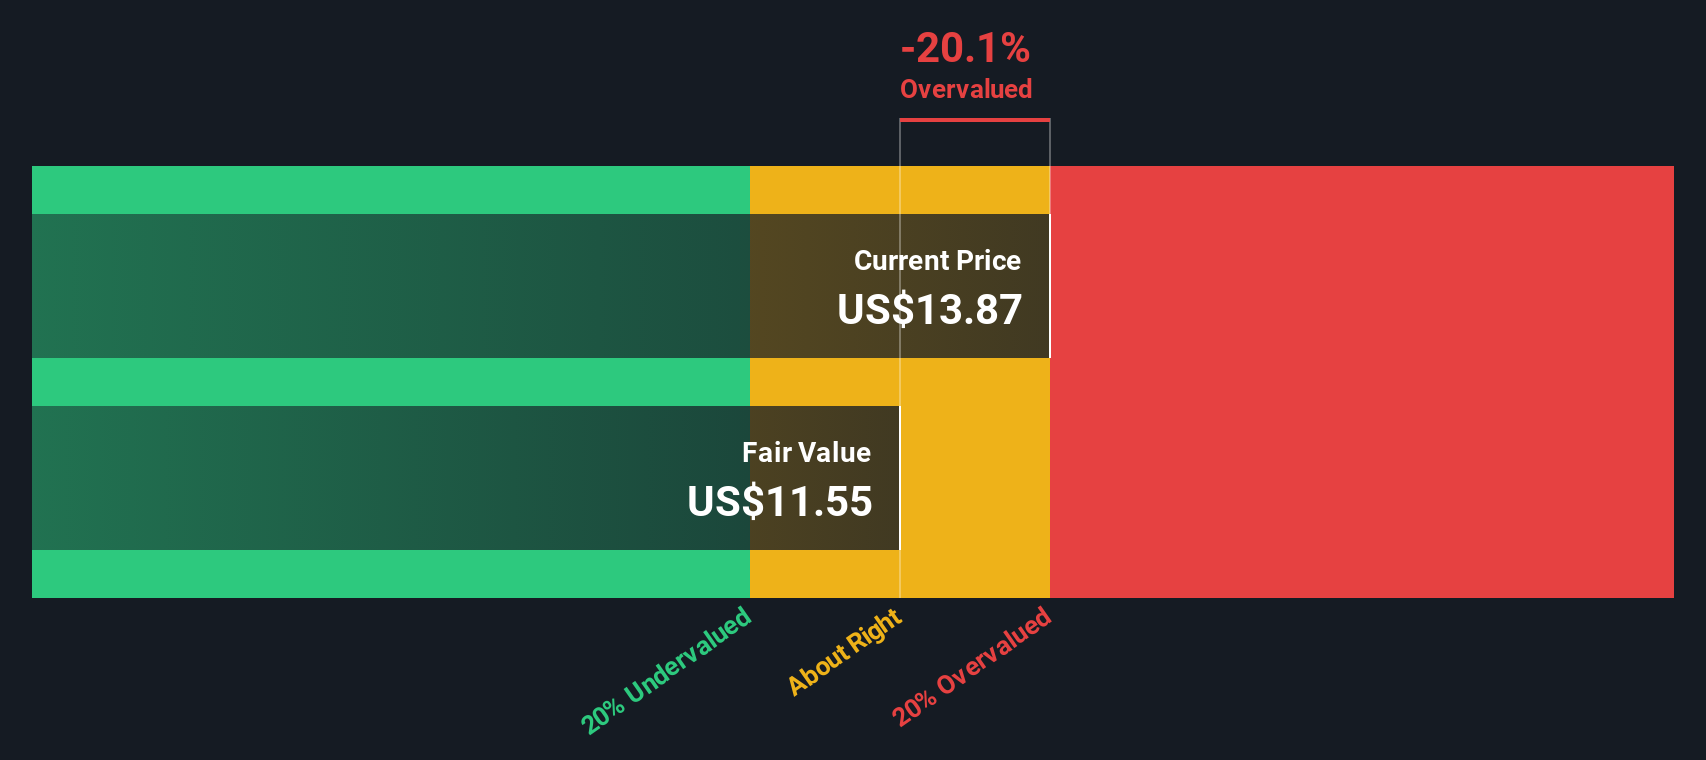
After discounting all projected cash flows back to their present value, the DCF model calculates Rivian's intrinsic value per share at $12.49. With the latest closing price at $12.80, this means the stock is trading about 2.5% above its estimated fair value. In simple terms, Rivian shares look fairly valued at current levels according to this method.
Result: ABOUT RIGHT
Simply Wall St performs a valuation analysis on every stock in the world every day (check out Rivian Automotive's valuation analysis). We show the entire calculation in full. You can track the result in your watchlist or portfolio and be alerted when this changes.
Approach 2: Rivian Automotive Price vs Sales
Price-to-Sales (P/S) is often the preferred valuation metric for companies that are still early in their growth story or not yet consistently profitable, like Rivian Automotive. Unlike Price-to-Earnings (P/E), which relies on positive net income, the P/S ratio instead compares stock price to revenues, making it useful when earnings are negative or volatile.
In rapidly growing industries such as electric vehicles, growth potential and market risks can drive the P/S multiple higher or lower. A higher-than-average P/S may be justified for a company with strong revenue expansion and a promising future, while companies facing uncertainties or slower growth may trade at lower P/S ratios.
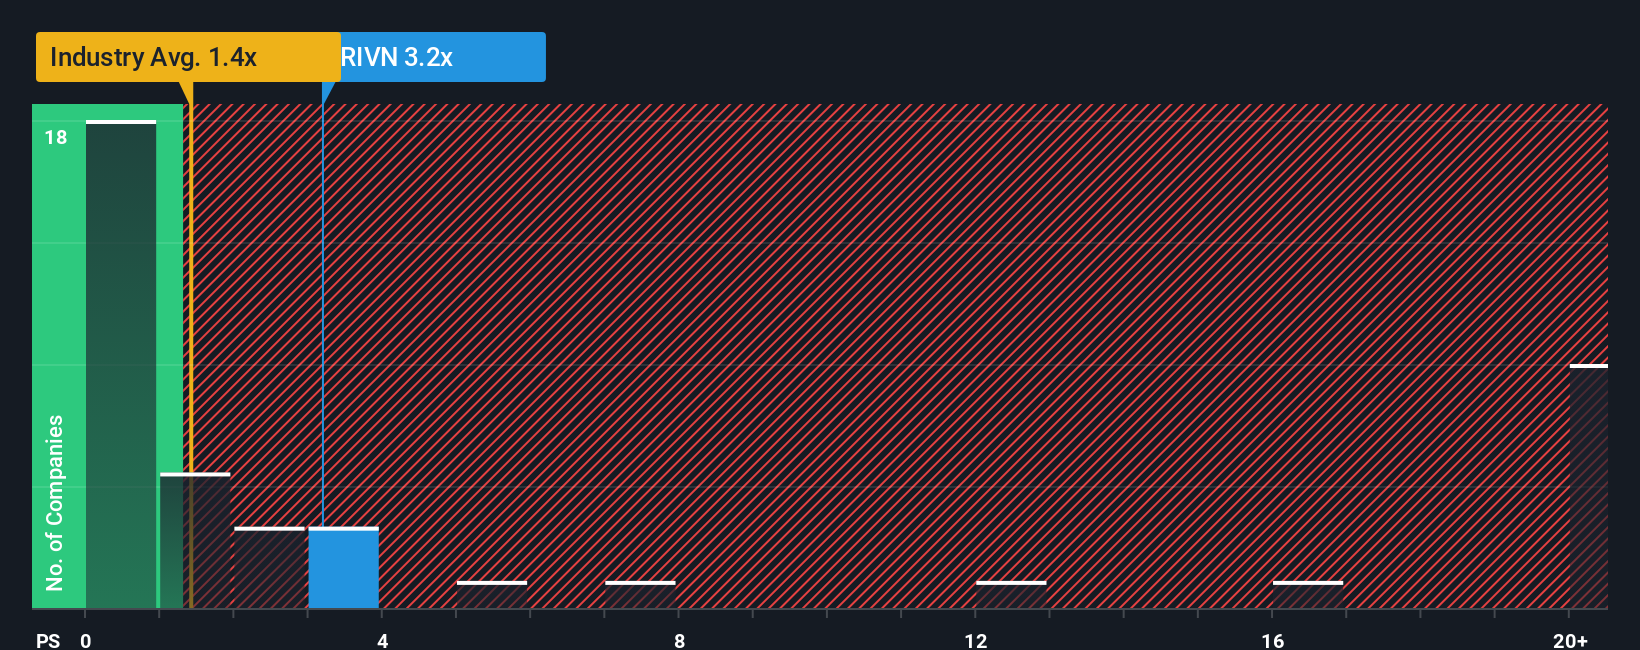
Currently, Rivian trades on a P/S ratio of 3.02x, meaning investors are paying $3.02 for every $1 of Rivian’s annual sales. This is higher than both the auto industry average of 1.32x and the peer group average of 1.48x. However, not all companies deserve the same multiple. Simply Wall St’s Fair Ratio for Rivian is 1.41x, reflecting expectations for growth, risks, profit margins, industry, and company size. This provides a more tailored valuation measure than raw peer or industry comparisons.
Comparing Rivian's actual multiple to its Fair Ratio, the difference is about 1.61x above fair value. This suggests that shares are trading above the level justified by these fundamentals and adjusting for all key factors.
Result: OVERVALUED
PS ratios tell one story, but what if the real opportunity lies elsewhere? Discover companies where insiders are betting big on explosive growth.
Upgrade Your Decision Making: Choose your Rivian Automotive Narrative
Earlier we mentioned that there's an even better way to understand valuation, so let’s introduce you to Narratives. A Narrative is your personal, story-driven perspective on a company, connecting your beliefs about its future to concrete financial forecasts and ultimately to your own fair value for the stock. Instead of just relying on a model or a consensus score, Narratives let you express the “why” behind your assumptions. For example, do you see Rivian launching breakthrough vehicles, unlocking new revenue streams, or overcoming industry headwinds faster than peers?
On Simply Wall St’s Community page, Narratives are accessible and dynamic tools used by millions of investors. They empower you to map the company’s story directly onto detailed forecasts for future revenues, earnings, and margins, then instantly compare your fair value estimate with today’s market price. Narratives stay current. When news like policy changes or earnings updates hits, your projections and fair value adjust in real time, helping you make timely buy or sell decisions.
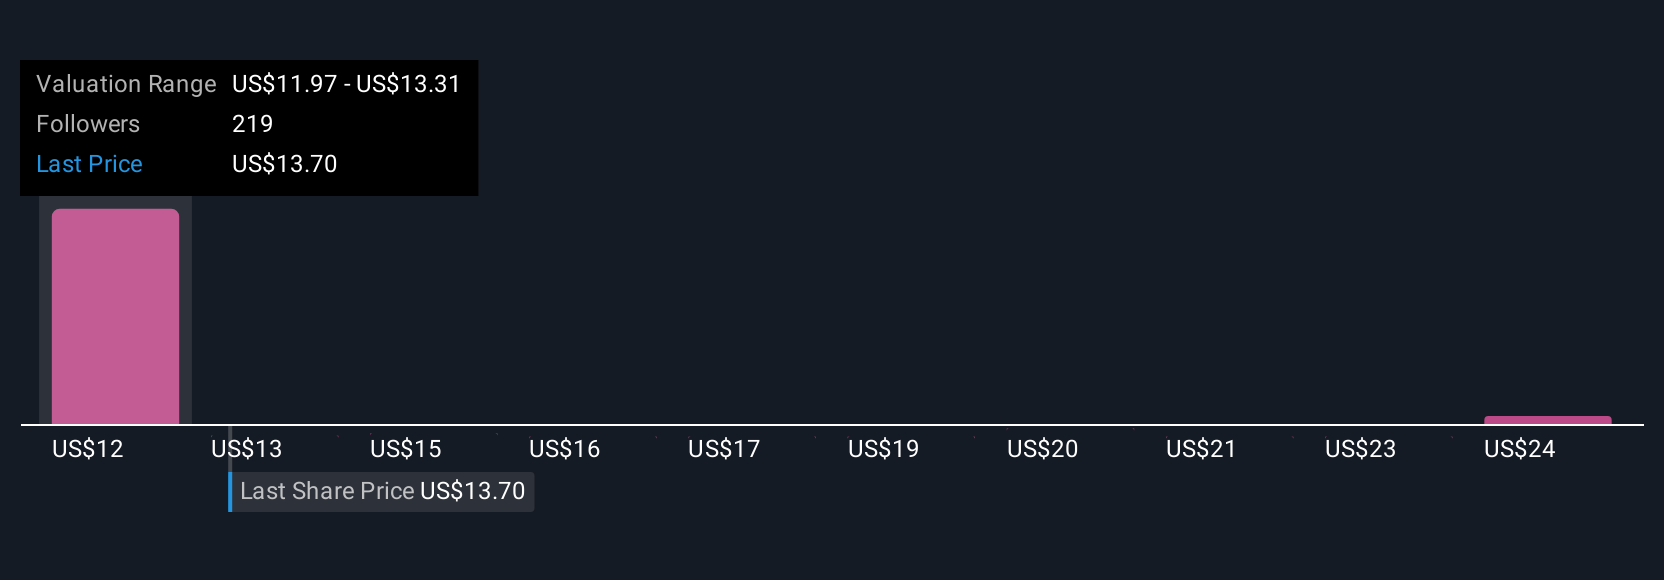
For example, some Rivian investors may see aggressive cost reductions and industry partnerships driving a fair value as high as $21.00 per share. Others concerned by slower EV adoption and margin pressures set their fair value closer to $7.55. Narratives make it easy to see, contrast, and refine these perspectives, including your own, all in one place.
Do you think there's more to the story for Rivian Automotive? Create your own Narrative to let the Community know!
This article by Simply Wall St is general in nature. We provide commentary based on historical data and analyst forecasts only using an unbiased methodology and our articles are not intended to be financial advice. It does not constitute a recommendation to buy or sell any stock, and does not take account of your objectives, or your financial situation. We aim to bring you long-term focused analysis driven by fundamental data. Note that our analysis may not factor in the latest price-sensitive company announcements or qualitative material. Simply Wall St has no position in any stocks mentioned.
The New Payments ETF Is Live on NASDAQ:
Money is moving to real-time rails, and a newly listed ETF now gives investors direct exposure. Fast settlement. Institutional custody. Simple access.
Explore how this launch could reshape portfolios
Sponsored ContentNew: AI Stock Screener & Alerts
Our new AI Stock Screener scans the market every day to uncover opportunities.
• Dividend Powerhouses (3%+ Yield)
• Undervalued Small Caps with Insider Buying
• High growth Tech and AI Companies
Or build your own from over 50 metrics.
Have feedback on this article? Concerned about the content? Get in touch with us directly. Alternatively, email editorial-team@simplywallst.com
About NasdaqGS:RIVN
Rivian Automotive
Designs, develops, manufactures, and sells electric vehicles and accessories.
Excellent balance sheet with limited growth.
Similar Companies
Market Insights

Weekly Picks

Early mover in a fast growing industry. Likely to experience share price volatility as they scale


A case for CA$31.80 (undiluted), aka 8,616% upside from CA$0.37 (an 86 bagger!).


Moderation and Stabilisation: HOLD: Fair Price based on a 4-year Cycle is $12.08
Recently Updated Narratives


Title: Market Sentiment Is Dead Wrong — Here's Why PSEC Deserves a Second Look


An amazing opportunity to potentially get a 100 bagger

Amazon: Why the World’s Biggest Platform Still Runs on Invisible Economics
Popular Narratives


MicroVision will explode future revenue by 380.37% with a vision towards success


Crazy Undervalued 42 Baggers Silver Play (Active & Running Mine)


NVDA: Expanding AI Demand Will Drive Major Data Center Investments Through 2026
Trending Discussion
