- Singapore
- /
- Consumer Services
- /
- SGX:RQ1
Does Overseas Education Limited's (SGX:RQ1) Weak Fundamentals Mean That The Stock Could Move In The Opposite Direction?

Most readers would already know that Overseas Education's (SGX:RQ1) stock increased by 6.8% over the past three months. Given that the markets usually pay for the long-term financial health of a company, we wonder if the current momentum in the share price will keep up, given that the company's financials don't look very promising. Specifically, we decided to study Overseas Education's ROE in this article.
ROE or return on equity is a useful tool to assess how effectively a company can generate returns on the investment it received from its shareholders. In other words, it is a profitability ratio which measures the rate of return on the capital provided by the company's shareholders.
See our latest analysis for Overseas Education
How Do You Calculate Return On Equity?
ROE can be calculated by using the formula:
Return on Equity = Net Profit (from continuing operations) ÷ Shareholders' Equity
So, based on the above formula, the ROE for Overseas Education is:
7.4% = S$10m ÷ S$138m (Based on the trailing twelve months to December 2020).
The 'return' is the yearly profit. That means that for every SGD1 worth of shareholders' equity, the company generated SGD0.07 in profit.
What Has ROE Got To Do With Earnings Growth?
Thus far, we have learned that ROE measures how efficiently a company is generating its profits. Depending on how much of these profits the company reinvests or "retains", and how effectively it does so, we are then able to assess a company’s earnings growth potential. Generally speaking, other things being equal, firms with a high return on equity and profit retention, have a higher growth rate than firms that don’t share these attributes.
Overseas Education's Earnings Growth And 7.4% ROE
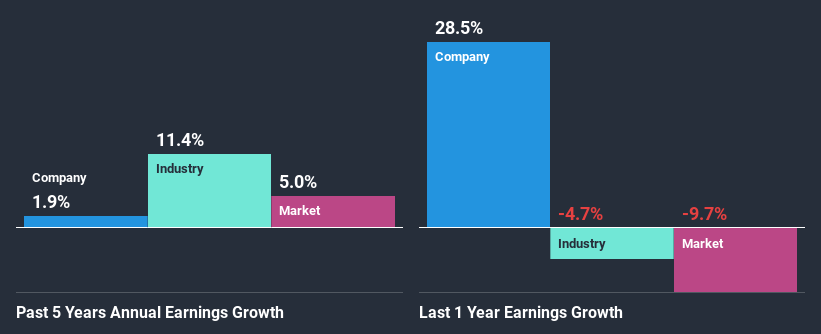
At first glance, Overseas Education's ROE doesn't look very promising. We then compared the company's ROE to the broader industry and were disappointed to see that the ROE is lower than the industry average of 10%. Hence, the flat earnings seen by Overseas Education over the past five years could probably be the result of it having a lower ROE.
As a next step, we compared Overseas Education's net income growth with the industry and were disappointed to see that the company's growth is lower than the industry average growth of 13% in the same period.
The basis for attaching value to a company is, to a great extent, tied to its earnings growth. The investor should try to establish if the expected growth or decline in earnings, whichever the case may be, is priced in. Doing so will help them establish if the stock's future looks promising or ominous. One good indicator of expected earnings growth is the P/E ratio which determines the price the market is willing to pay for a stock based on its earnings prospects. So, you may want to check if Overseas Education is trading on a high P/E or a low P/E, relative to its industry.
Is Overseas Education Making Efficient Use Of Its Profits?
Overseas Education has a three-year median payout ratio as high as 161% meaning that the company is paying a dividend which is beyond its means. The absence in growth is therefore not surprising. Paying a dividend beyond their means is usually not viable over the long term. This is quite a risky position to be in. You can see the 3 risks we have identified for Overseas Education by visiting our risks dashboard for free on our platform here.
In addition, Overseas Education has been paying dividends over a period of eight years suggesting that keeping up dividend payments is way more important to the management even if it comes at the cost of business growth.
Conclusion
Overall, we would be extremely cautious before making any decision on Overseas Education. Specifically, it has shown quite an unsatisfactory performance as far as earnings growth is concerned, and a poor ROE and an equally poor rate of reinvestment seem to be the reason behind this inadequate performance. So far, we've only made a quick discussion around the company's earnings growth. So it may be worth checking this free detailed graph of Overseas Education's past earnings, as well as revenue and cash flows to get a deeper insight into the company's performance.
If you decide to trade Overseas Education, use the lowest-cost* platform that is rated #1 Overall by Barron’s, Interactive Brokers. Trade stocks, options, futures, forex, bonds and funds on 135 markets, all from a single integrated account. Promoted
Mobile Infrastructure for Defense and Disaster
The next wave in robotics isn't humanoid. Its fully autonomous towers delivering 5G, ISR, and radar in under 30 minutes, anywhere.
Get the investor briefing before the next round of contracts
Sponsored On Behalf of CiTechNew: AI Stock Screener & Alerts
Our new AI Stock Screener scans the market every day to uncover opportunities.
• Dividend Powerhouses (3%+ Yield)
• Undervalued Small Caps with Insider Buying
• High growth Tech and AI Companies
Or build your own from over 50 metrics.
This article by Simply Wall St is general in nature. It does not constitute a recommendation to buy or sell any stock, and does not take account of your objectives, or your financial situation. We aim to bring you long-term focused analysis driven by fundamental data. Note that our analysis may not factor in the latest price-sensitive company announcements or qualitative material. Simply Wall St has no position in any stocks mentioned.
*Interactive Brokers Rated Lowest Cost Broker by StockBrokers.com Annual Online Review 2020
Have feedback on this article? Concerned about the content? Get in touch with us directly. Alternatively, email editorial-team (at) simplywallst.com.
About SGX:RQ1
Overseas Education
An investment holding company, operates a foreign system school in Singapore.
Adequate balance sheet with slight risk.
Similar Companies
Market Insights

Weekly Picks

THE KINGDOM OF BROWN GOODS: WHY MGPI IS BEING CRUSHED BY INVENTORY & PRIMED FOR RESURRECTION


Why Vertical Aerospace (NYSE: EVTL) is Worth Possibly Over 13x its Current Price


The Quiet Giant That Became AI’s Power Grid
Recently Updated Narratives

Butler National (Buks) outperforms.


A tech powerhouse quietly powering the world’s AI infrastructure.


Keppel DC REIT (SGX: AJBU) is a resilient gem in the data center space.
Popular Narratives

MicroVision will explode future revenue by 380.37% with a vision towards success


Crazy Undervalued 42 Baggers Silver Play (Active & Running Mine)


