
Advertisement
- Singapore
- /
- Food and Staples Retail
- /
- SGX:VC2
Olam Group's (SGX:VC2 three-year decrease in earnings delivers investors with a 34% loss

For many investors, the main point of stock picking is to generate higher returns than the overall market. But its virtually certain that sometimes you will buy stocks that fall short of the market average returns. Unfortunately, that's been the case for longer term Olam Group Limited (SGX:VC2) shareholders, since the share price is down 44% in the last three years, falling well short of the market return of around 23%. Shareholders have had an even rougher run lately, with the share price down 19% in the last 90 days. This could be related to the recent financial results - you can catch up on the most recent data by reading our company report.
If the past week is anything to go by, investor sentiment for Olam Group isn't positive, so let's see if there's a mismatch between fundamentals and the share price.
View our latest analysis for Olam Group
To paraphrase Benjamin Graham: Over the short term the market is a voting machine, but over the long term it's a weighing machine. One way to examine how market sentiment has changed over time is to look at the interaction between a company's share price and its earnings per share (EPS).
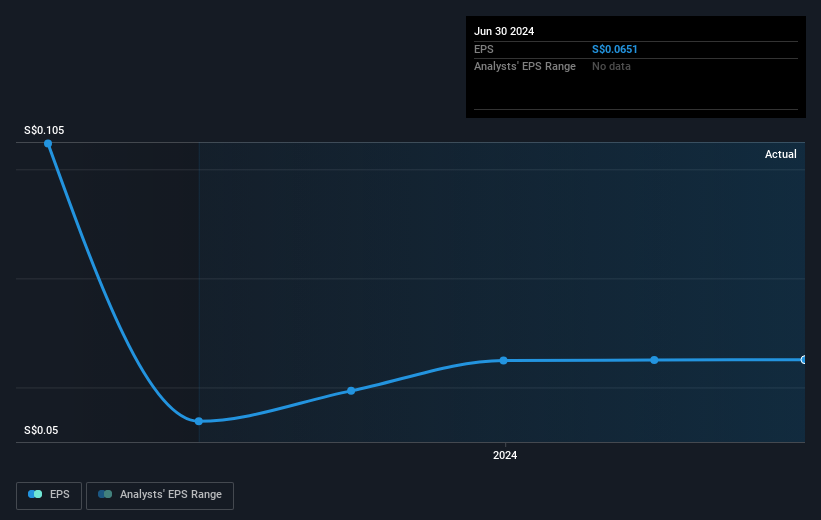
Olam Group saw its EPS decline at a compound rate of 50% per year, over the last three years. In comparison the 17% compound annual share price decline isn't as bad as the EPS drop-off. So, despite the prior disappointment, shareholders must have some confidence the situation will improve, longer term.
The company's earnings per share (over time) is depicted in the image below (click to see the exact numbers).
It's good to see that there was some significant insider buying in the last three months. That's a positive. On the other hand, we think the revenue and earnings trends are much more meaningful measures of the business. Dive deeper into the earnings by checking this interactive graph of Olam Group's earnings, revenue and cash flow.
What About Dividends?
When looking at investment returns, it is important to consider the difference between total shareholder return (TSR) and share price return. The TSR is a return calculation that accounts for the value of cash dividends (assuming that any dividend received was reinvested) and the calculated value of any discounted capital raisings and spin-offs. So for companies that pay a generous dividend, the TSR is often a lot higher than the share price return. As it happens, Olam Group's TSR for the last 3 years was -34%, which exceeds the share price return mentioned earlier. The dividends paid by the company have thusly boosted the total shareholder return.
A Different Perspective
Olam Group shareholders gained a total return of 8.4% during the year. Unfortunately this falls short of the market return. On the bright side, that's still a gain, and it is certainly better than the yearly loss of about 4% endured over half a decade. So this might be a sign the business has turned its fortunes around. I find it very interesting to look at share price over the long term as a proxy for business performance. But to truly gain insight, we need to consider other information, too. Case in point: We've spotted 5 warning signs for Olam Group you should be aware of, and 4 of them are potentially serious.
There are plenty of other companies that have insiders buying up shares. You probably do not want to miss this free list of undervalued small cap companies that insiders are buying.
Please note, the market returns quoted in this article reflect the market weighted average returns of stocks that currently trade on Singaporean exchanges.
New: AI Stock Screener & Alerts
Our new AI Stock Screener scans the market every day to uncover opportunities.
• Dividend Powerhouses (3%+ Yield)
• Undervalued Small Caps with Insider Buying
• High growth Tech and AI Companies
Or build your own from over 50 metrics.
Have feedback on this article? Concerned about the content? Get in touch with us directly. Alternatively, email editorial-team (at) simplywallst.com.
This article by Simply Wall St is general in nature. We provide commentary based on historical data and analyst forecasts only using an unbiased methodology and our articles are not intended to be financial advice. It does not constitute a recommendation to buy or sell any stock, and does not take account of your objectives, or your financial situation. We aim to bring you long-term focused analysis driven by fundamental data. Note that our analysis may not factor in the latest price-sensitive company announcements or qualitative material. Simply Wall St has no position in any stocks mentioned.
About SGX:VC2
Olam Group
Engages in the sourcing, processing, packaging, and merchandising of agricultural products worldwide.
Moderate second-rate dividend payer.
Similar Companies
Market Insights

Advertisement
Community Narratives
RIO is poised to weather a depressed iron ore environment, but commodity diversification comes with lower margins
Fair Value AU$110.51|4.0% overvalued
DU
Community Contributor
The demand for personalized medicine will keep Thermo Fisher Scientific thriving
Fair Value US$540.27|20.1% undervalued
UN
Community Contributor
Silver Play by A Family with 10x Potential
Fair Value UK£24.00|88.5% undervalued
RO
Community Contributor