- Poland
- /
- Telecom Services and Carriers
- /
- WSE:OPL
Is There An Opportunity With Orange Polska S.A.'s (WSE:OPL) 27% Undervaluation?


Key Insights
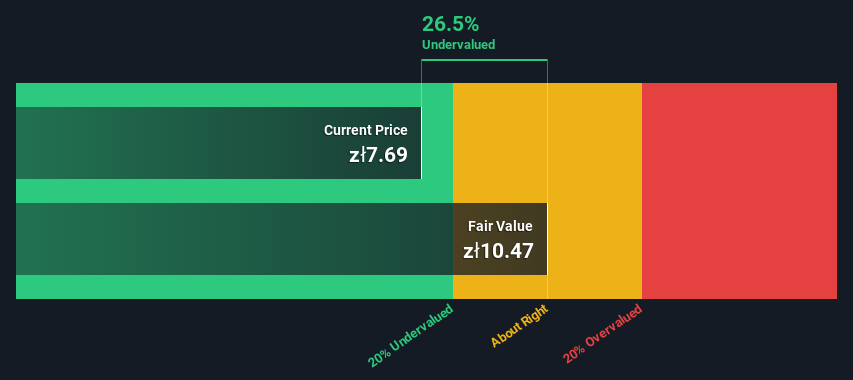
- Using the 2 Stage Free Cash Flow to Equity, Orange Polska fair value estimate is zł10.47
- Current share price of zł7.69 suggests Orange Polska is potentially 27% undervalued
- The zł8.25 analyst price target for OPL is 21% less than our estimate of fair value
Today we will run through one way of estimating the intrinsic value of Orange Polska S.A. (WSE:OPL) by taking the expected future cash flows and discounting them to today's value. One way to achieve this is by employing the Discounted Cash Flow (DCF) model. Believe it or not, it's not too difficult to follow, as you'll see from our example!
We generally believe that a company's value is the present value of all of the cash it will generate in the future. However, a DCF is just one valuation metric among many, and it is not without flaws. If you want to learn more about discounted cash flow, the rationale behind this calculation can be read in detail in the Simply Wall St analysis model.
Check out our latest analysis for Orange Polska
Crunching The Numbers
We're using the 2-stage growth model, which simply means we take in account two stages of company's growth. In the initial period the company may have a higher growth rate and the second stage is usually assumed to have a stable growth rate. To start off with, we need to estimate the next ten years of cash flows. Where possible we use analyst estimates, but when these aren't available we extrapolate the previous free cash flow (FCF) from the last estimate or reported value. We assume companies with shrinking free cash flow will slow their rate of shrinkage, and that companies with growing free cash flow will see their growth rate slow, over this period. We do this to reflect that growth tends to slow more in the early years than it does in later years.
Generally we assume that a dollar today is more valuable than a dollar in the future, and so the sum of these future cash flows is then discounted to today's value:
10-year free cash flow (FCF) forecast
| 2024 | 2025 | 2026 | 2027 | 2028 | 2029 | 2030 | 2031 | 2032 | 2033 | |
| Levered FCF (PLN, Millions) | zł1.30b | zł1.40b | zł1.36b | zł853.0m | zł794.9m | zł765.0m | zł752.4m | zł751.2m | zł757.8m | zł770.0m |
| Growth Rate Estimate Source | Analyst x2 | Analyst x2 | Analyst x1 | Analyst x1 | Est @ -6.81% | Est @ -3.77% | Est @ -1.65% | Est @ -0.16% | Est @ 0.88% | Est @ 1.61% |
| Present Value (PLN, Millions) Discounted @ 8.3% | zł1.2k | zł1.2k | zł1.1k | zł619 | zł533 | zł473 | zł430 | zł396 | zł369 | zł346 |
("Est" = FCF growth rate estimated by Simply Wall St)
Present Value of 10-year Cash Flow (PVCF) = zł6.6b
After calculating the present value of future cash flows in the initial 10-year period, we need to calculate the Terminal Value, which accounts for all future cash flows beyond the first stage. For a number of reasons a very conservative growth rate is used that cannot exceed that of a country's GDP growth. In this case we have used the 5-year average of the 10-year government bond yield (3.3%) to estimate future growth. In the same way as with the 10-year 'growth' period, we discount future cash flows to today's value, using a cost of equity of 8.3%.
Terminal Value (TV)= FCF2033 × (1 + g) ÷ (r – g) = zł770m× (1 + 3.3%) ÷ (8.3%– 3.3%) = zł16b
Present Value of Terminal Value (PVTV)= TV / (1 + r)10= zł16b÷ ( 1 + 8.3%)10= zł7.1b
The total value, or equity value, is then the sum of the present value of the future cash flows, which in this case is zł14b. The last step is to then divide the equity value by the number of shares outstanding. Relative to the current share price of zł7.7, the company appears a touch undervalued at a 27% discount to where the stock price trades currently. The assumptions in any calculation have a big impact on the valuation, so it is better to view this as a rough estimate, not precise down to the last cent.
Important Assumptions
The calculation above is very dependent on two assumptions. The first is the discount rate and the other is the cash flows. You don't have to agree with these inputs, I recommend redoing the calculations yourself and playing with them. The DCF also does not consider the possible cyclicality of an industry, or a company's future capital requirements, so it does not give a full picture of a company's potential performance. Given that we are looking at Orange Polska as potential shareholders, the cost of equity is used as the discount rate, rather than the cost of capital (or weighted average cost of capital, WACC) which accounts for debt. In this calculation we've used 8.3%, which is based on a levered beta of 0.800. Beta is a measure of a stock's volatility, compared to the market as a whole. We get our beta from the industry average beta of globally comparable companies, with an imposed limit between 0.8 and 2.0, which is a reasonable range for a stable business.
SWOT Analysis for Orange Polska
- Debt is not viewed as a risk.
- Earnings declined over the past year.
- Dividend is low compared to the top 25% of dividend payers in the Telecom market.
- Annual revenue is forecast to grow faster than the Polish market.
- Good value based on P/E ratio and estimated fair value.
- Dividends are not covered by cash flow.
- Annual earnings are forecast to grow slower than the Polish market.
Moving On:
Although the valuation of a company is important, it is only one of many factors that you need to assess for a company. It's not possible to obtain a foolproof valuation with a DCF model. Preferably you'd apply different cases and assumptions and see how they would impact the company's valuation. For example, changes in the company's cost of equity or the risk free rate can significantly impact the valuation. What is the reason for the share price sitting below the intrinsic value? For Orange Polska, there are three important factors you should look at:
- Risks: Every company has them, and we've spotted 2 warning signs for Orange Polska you should know about.
- Future Earnings: How does OPL's growth rate compare to its peers and the wider market? Dig deeper into the analyst consensus number for the upcoming years by interacting with our free analyst growth expectation chart.
- Other High Quality Alternatives: Do you like a good all-rounder? Explore our interactive list of high quality stocks to get an idea of what else is out there you may be missing!
PS. Simply Wall St updates its DCF calculation for every Polish stock every day, so if you want to find the intrinsic value of any other stock just search here.
If you're looking to trade Orange Polska, open an account with the lowest-cost platform trusted by professionals, Interactive Brokers.
With clients in over 200 countries and territories, and access to 160 markets, IBKR lets you trade stocks, options, futures, forex, bonds and funds from a single integrated account.
Enjoy no hidden fees, no account minimums, and FX conversion rates as low as 0.03%, far better than what most brokers offer.
Sponsored ContentNew: AI Stock Screener & Alerts
Our new AI Stock Screener scans the market every day to uncover opportunities.
• Dividend Powerhouses (3%+ Yield)
• Undervalued Small Caps with Insider Buying
• High growth Tech and AI Companies
Or build your own from over 50 metrics.
Have feedback on this article? Concerned about the content? Get in touch with us directly. Alternatively, email editorial-team (at) simplywallst.com.
This article by Simply Wall St is general in nature. We provide commentary based on historical data and analyst forecasts only using an unbiased methodology and our articles are not intended to be financial advice. It does not constitute a recommendation to buy or sell any stock, and does not take account of your objectives, or your financial situation. We aim to bring you long-term focused analysis driven by fundamental data. Note that our analysis may not factor in the latest price-sensitive company announcements or qualitative material. Simply Wall St has no position in any stocks mentioned.
About WSE:OPL
Orange Polska
Provides telecommunications services for individuals, businesses, and wholesale customers in Poland.
Good value with adequate balance sheet and pays a dividend.
Similar Companies
Market Insights

Community Narratives

