- Malaysia
- /
- Oil and Gas
- /
- KLSE:FAST
Are Strong Financial Prospects The Force That Is Driving The Momentum In Techfast Holdings Berhad's KLSE:TECFAST) Stock?

Techfast Holdings Berhad's (KLSE:TECFAST) stock is up by a considerable 30% over the past three months. Since the market usually pay for a company’s long-term fundamentals, we decided to study the company’s key performance indicators to see if they could be influencing the market. Particularly, we will be paying attention to Techfast Holdings Berhad's ROE today.
Return on equity or ROE is an important factor to be considered by a shareholder because it tells them how effectively their capital is being reinvested. In simpler terms, it measures the profitability of a company in relation to shareholder's equity.
See our latest analysis for Techfast Holdings Berhad
How To Calculate Return On Equity?
The formula for ROE is:
Return on Equity = Net Profit (from continuing operations) ÷ Shareholders' Equity
So, based on the above formula, the ROE for Techfast Holdings Berhad is:
13% = RM3.7m ÷ RM28m (Based on the trailing twelve months to March 2020).
The 'return' is the profit over the last twelve months. That means that for every MYR1 worth of shareholders' equity, the company generated MYR0.13 in profit.
What Has ROE Got To Do With Earnings Growth?
We have already established that ROE serves as an efficient profit-generating gauge for a company's future earnings. Based on how much of its profits the company chooses to reinvest or "retain", we are then able to evaluate a company's future ability to generate profits. Generally speaking, other things being equal, firms with a high return on equity and profit retention, have a higher growth rate than firms that don’t share these attributes.
A Side By Side comparison of Techfast Holdings Berhad's Earnings Growth And 13% ROE
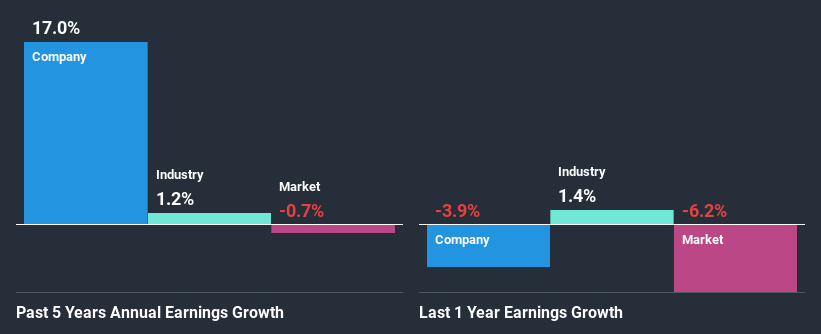
At first glance, Techfast Holdings Berhad seems to have a decent ROE. On comparing with the average industry ROE of 9.1% the company's ROE looks pretty remarkable. Probably as a result of this, Techfast Holdings Berhad was able to see a decent growth of 17% over the last five years.
As a next step, we compared Techfast Holdings Berhad's net income growth with the industry, and pleasingly, we found that the growth seen by the company is higher than the average industry growth of 1.2%.
Earnings growth is an important metric to consider when valuing a stock. The investor should try to establish if the expected growth or decline in earnings, whichever the case may be, is priced in. Doing so will help them establish if the stock's future looks promising or ominous. One good indicator of expected earnings growth is the P/E ratio which determines the price the market is willing to pay for a stock based on its earnings prospects. So, you may want to check if Techfast Holdings Berhad is trading on a high P/E or a low P/E, relative to its industry.
Is Techfast Holdings Berhad Efficiently Re-investing Its Profits?
While Techfast Holdings Berhad has a three-year median payout ratio of 57% (which means it retains 43% of profits), the company has still seen a fair bit of earnings growth in the past, meaning that its high payout ratio hasn't hampered its ability to grow.
Conclusion
Overall, we are quite pleased with Techfast Holdings Berhad's performance. In particular, its high ROE is quite noteworthy and also the probable explanation behind its considerable earnings growth. Yet, the company is retaining a small portion of its profits. Which means that the company has been able to grow its earnings in spite of it, so that's not too bad. Until now, we have only just grazed the surface of the company's past performance by looking at the company's fundamentals. So it may be worth checking this free detailed graph of Techfast Holdings Berhad's past earnings, as well as revenue and cash flows to get a deeper insight into the company's performance.
When trading Techfast Holdings Berhad or any other investment, use the platform considered by many to be the Professional's Gateway to the Worlds Market, Interactive Brokers. You get the lowest-cost* trading on stocks, options, futures, forex, bonds and funds worldwide from a single integrated account. Promoted
The New Payments ETF Is Live on NASDAQ:
Money is moving to real-time rails, and a newly listed ETF now gives investors direct exposure. Fast settlement. Institutional custody. Simple access.
Explore how this launch could reshape portfolios
Sponsored ContentNew: AI Stock Screener & Alerts
Our new AI Stock Screener scans the market every day to uncover opportunities.
• Dividend Powerhouses (3%+ Yield)
• Undervalued Small Caps with Insider Buying
• High growth Tech and AI Companies
Or build your own from over 50 metrics.
This article by Simply Wall St is general in nature. It does not constitute a recommendation to buy or sell any stock, and does not take account of your objectives, or your financial situation. We aim to bring you long-term focused analysis driven by fundamental data. Note that our analysis may not factor in the latest price-sensitive company announcements or qualitative material. Simply Wall St has no position in any stocks mentioned.
*Interactive Brokers Rated Lowest Cost Broker by StockBrokers.com Annual Online Review 2020
Have feedback on this article? Concerned about the content? Get in touch with us directly. Alternatively, email editorial-team@simplywallst.com.
About KLSE:FAST
Fast Energy Holdings Berhad
An investment holding company, engages in oil trading and bunkering services business in Malaysia.
Excellent balance sheet and good value.
Market Insights

Weekly Picks

THE KINGDOM OF BROWN GOODS: WHY MGPI IS BEING CRUSHED BY INVENTORY & PRIMED FOR RESURRECTION


Why Vertical Aerospace (NYSE: EVTL) is Worth Possibly Over 13x its Current Price


The Quiet Giant That Became AI’s Power Grid
Recently Updated Narratives


Unicycive Therapeutics (Nasdaq: UNCY) – Preparing for a Second Shot at Bringing a New Kidney Treatment to Market (TEST)

Rocket Lab USA Will Ignite a 30% Revenue Growth Journey


Dollar general to grow
Popular Narratives


MicroVision will explode future revenue by 380.37% with a vision towards success


NVDA: Expanding AI Demand Will Drive Major Data Center Investments Through 2026


