- Japan
- /
- Wireless Telecom
- /
- TSE:9433
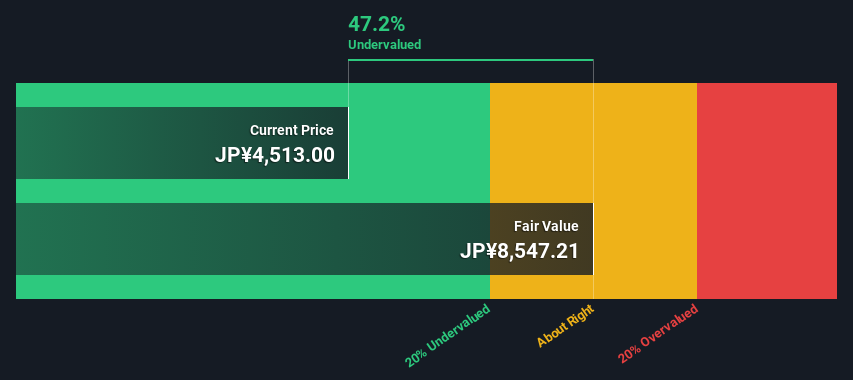
Is There An Opportunity With KDDI Corporation's (TSE:9433) 47% Undervaluation?


Key Insights
- The projected fair value for KDDI is JP¥8,547 based on 2 Stage Free Cash Flow to Equity
- Current share price of JP¥4,513 suggests KDDI is potentially 47% undervalued
- The JP¥4,969 analyst price target for 9433 is 42% less than our estimate of fair value
Today we will run through one way of estimating the intrinsic value of KDDI Corporation (TSE:9433) by taking the expected future cash flows and discounting them to today's value. Our analysis will employ the Discounted Cash Flow (DCF) model. Before you think you won't be able to understand it, just read on! It's actually much less complex than you'd imagine.
Companies can be valued in a lot of ways, so we would point out that a DCF is not perfect for every situation. Anyone interested in learning a bit more about intrinsic value should have a read of the Simply Wall St analysis model.
Check out our latest analysis for KDDI
What's The Estimated Valuation?
We are going to use a two-stage DCF model, which, as the name states, takes into account two stages of growth. The first stage is generally a higher growth period which levels off heading towards the terminal value, captured in the second 'steady growth' period. To begin with, we have to get estimates of the next ten years of cash flows. Where possible we use analyst estimates, but when these aren't available we extrapolate the previous free cash flow (FCF) from the last estimate or reported value. We assume companies with shrinking free cash flow will slow their rate of shrinkage, and that companies with growing free cash flow will see their growth rate slow, over this period. We do this to reflect that growth tends to slow more in the early years than it does in later years.
A DCF is all about the idea that a dollar in the future is less valuable than a dollar today, and so the sum of these future cash flows is then discounted to today's value:
10-year free cash flow (FCF) estimate
| 2024 | 2025 | 2026 | 2027 | 2028 | 2029 | 2030 | 2031 | 2032 | 2033 | |
| Levered FCF (¥, Millions) | JP¥597.4b | JP¥721.5b | JP¥722.1b | JP¥800.3b | JP¥811.0b | JP¥818.2b | JP¥823.7b | JP¥828.0b | JP¥831.4b | JP¥834.2b |
| Growth Rate Estimate Source | Analyst x6 | Analyst x5 | Analyst x7 | Analyst x4 | Analyst x3 | Est @ 0.89% | Est @ 0.67% | Est @ 0.52% | Est @ 0.41% | Est @ 0.34% |
| Present Value (¥, Millions) Discounted @ 4.7% | JP¥570.8k | JP¥658.7k | JP¥629.8k | JP¥666.9k | JP¥645.7k | JP¥622.4k | JP¥598.7k | JP¥575.0k | JP¥551.6k | JP¥528.8k |
("Est" = FCF growth rate estimated by Simply Wall St)
Present Value of 10-year Cash Flow (PVCF) = JP¥6.0t
After calculating the present value of future cash flows in the initial 10-year period, we need to calculate the Terminal Value, which accounts for all future cash flows beyond the first stage. For a number of reasons a very conservative growth rate is used that cannot exceed that of a country's GDP growth. In this case we have used the 5-year average of the 10-year government bond yield (0.2%) to estimate future growth. In the same way as with the 10-year 'growth' period, we discount future cash flows to today's value, using a cost of equity of 4.7%.
Terminal Value (TV)= FCF2033 × (1 + g) ÷ (r – g) = JP¥834b× (1 + 0.2%) ÷ (4.7%– 0.2%) = JP¥19t
Present Value of Terminal Value (PVTV)= TV / (1 + r)10= JP¥19t÷ ( 1 + 4.7%)10= JP¥12t
The total value, or equity value, is then the sum of the present value of the future cash flows, which in this case is JP¥18t. The last step is to then divide the equity value by the number of shares outstanding. Compared to the current share price of JP¥4.5k, the company appears quite good value at a 47% discount to where the stock price trades currently. The assumptions in any calculation have a big impact on the valuation, so it is better to view this as a rough estimate, not precise down to the last cent.
Important Assumptions
The calculation above is very dependent on two assumptions. The first is the discount rate and the other is the cash flows. You don't have to agree with these inputs, I recommend redoing the calculations yourself and playing with them. The DCF also does not consider the possible cyclicality of an industry, or a company's future capital requirements, so it does not give a full picture of a company's potential performance. Given that we are looking at KDDI as potential shareholders, the cost of equity is used as the discount rate, rather than the cost of capital (or weighted average cost of capital, WACC) which accounts for debt. In this calculation we've used 4.7%, which is based on a levered beta of 0.800. Beta is a measure of a stock's volatility, compared to the market as a whole. We get our beta from the industry average beta of globally comparable companies, with an imposed limit between 0.8 and 2.0, which is a reasonable range for a stable business.
SWOT Analysis for KDDI
- Earnings growth over the past year exceeded its 5-year average.
- Debt is not viewed as a risk.
- Dividends are covered by earnings and cash flows.
- Earnings growth over the past year underperformed the Wireless Telecom industry.
- Dividend is low compared to the top 25% of dividend payers in the Wireless Telecom market.
- Annual earnings are forecast to grow for the next 3 years.
- Good value based on P/E ratio and estimated fair value.
- Annual earnings are forecast to grow slower than the Japanese market.
Next Steps:
Valuation is only one side of the coin in terms of building your investment thesis, and it is only one of many factors that you need to assess for a company. DCF models are not the be-all and end-all of investment valuation. Rather it should be seen as a guide to "what assumptions need to be true for this stock to be under/overvalued?" For instance, if the terminal value growth rate is adjusted slightly, it can dramatically alter the overall result. Why is the intrinsic value higher than the current share price? For KDDI, we've put together three essential elements you should look at:
- Risks: Take risks, for example - KDDI has 1 warning sign we think you should be aware of.
- Future Earnings: How does 9433's growth rate compare to its peers and the wider market? Dig deeper into the analyst consensus number for the upcoming years by interacting with our free analyst growth expectation chart.
- Other High Quality Alternatives: Do you like a good all-rounder? Explore our interactive list of high quality stocks to get an idea of what else is out there you may be missing!
PS. The Simply Wall St app conducts a discounted cash flow valuation for every stock on the TSE every day. If you want to find the calculation for other stocks just search here.
Valuation is complex, but we're here to simplify it.
Discover if KDDI might be undervalued or overvalued with our detailed analysis, featuring fair value estimates, potential risks, dividends, insider trades, and its financial condition.
Access Free AnalysisHave feedback on this article? Concerned about the content? Get in touch with us directly. Alternatively, email editorial-team (at) simplywallst.com.
This article by Simply Wall St is general in nature. We provide commentary based on historical data and analyst forecasts only using an unbiased methodology and our articles are not intended to be financial advice. It does not constitute a recommendation to buy or sell any stock, and does not take account of your objectives, or your financial situation. We aim to bring you long-term focused analysis driven by fundamental data. Note that our analysis may not factor in the latest price-sensitive company announcements or qualitative material. Simply Wall St has no position in any stocks mentioned.
About TSE:9433
KDDI
Engages in the provision of telecommunications services in Japan and internationally.
Good value with adequate balance sheet and pays a dividend.
