- Japan
- /
- Telecom Services and Carriers
- /
- TSE:9418
U-NEXT HOLDINGSLtd's (TSE:9418) earnings growth rate lags the 33% CAGR delivered to shareholders

For many, the main point of investing in the stock market is to achieve spectacular returns. And highest quality companies can see their share prices grow by huge amounts. Don't believe it? Then look at the U-NEXT HOLDINGS Co.,Ltd. (TSE:9418) share price. It's 305% higher than it was five years ago. And this is just one example of the epic gains achieved by some long term investors. In the last week shares have slid back 6.6%.
Although U-NEXT HOLDINGSLtd has shed JP¥21b from its market cap this week, let's take a look at its longer term fundamental trends and see if they've driven returns.
See our latest analysis for U-NEXT HOLDINGSLtd
To quote Buffett, 'Ships will sail around the world but the Flat Earth Society will flourish. There will continue to be wide discrepancies between price and value in the marketplace...' One flawed but reasonable way to assess how sentiment around a company has changed is to compare the earnings per share (EPS) with the share price.
Over half a decade, U-NEXT HOLDINGSLtd managed to grow its earnings per share at 18% a year. This EPS growth is slower than the share price growth of 32% per year, over the same period. So it's fair to assume the market has a higher opinion of the business than it did five years ago. That's not necessarily surprising considering the five-year track record of earnings growth.
You can see how EPS has changed over time in the image below (click on the chart to see the exact values).
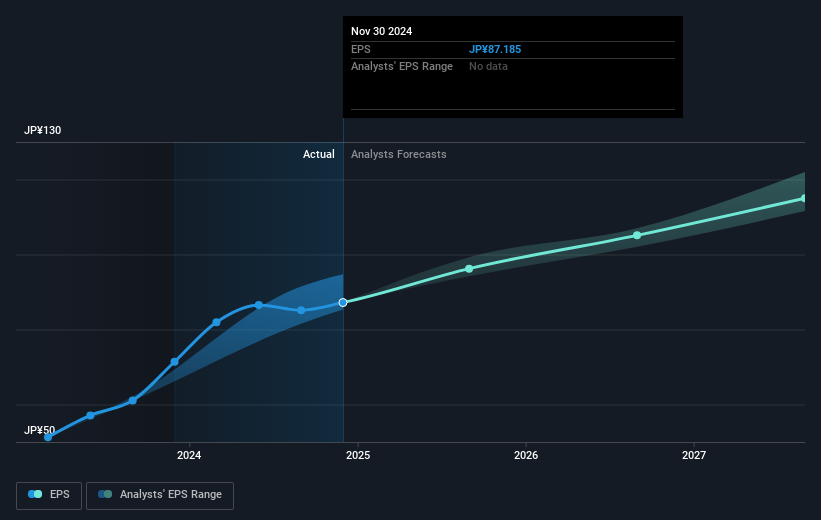
We know that U-NEXT HOLDINGSLtd has improved its bottom line lately, but is it going to grow revenue? If you're interested, you could check this free report showing consensus revenue forecasts.
What About Dividends?
When looking at investment returns, it is important to consider the difference between total shareholder return (TSR) and share price return. Whereas the share price return only reflects the change in the share price, the TSR includes the value of dividends (assuming they were reinvested) and the benefit of any discounted capital raising or spin-off. It's fair to say that the TSR gives a more complete picture for stocks that pay a dividend. We note that for U-NEXT HOLDINGSLtd the TSR over the last 5 years was 320%, which is better than the share price return mentioned above. And there's no prize for guessing that the dividend payments largely explain the divergence!
A Different Perspective
It's good to see that U-NEXT HOLDINGSLtd has rewarded shareholders with a total shareholder return of 8.0% in the last twelve months. Of course, that includes the dividend. However, the TSR over five years, coming in at 33% per year, is even more impressive. The pessimistic view would be that be that the stock has its best days behind it, but on the other hand the price might simply be moderating while the business itself continues to execute. Before deciding if you like the current share price, check how U-NEXT HOLDINGSLtd scores on these 3 valuation metrics.
We will like U-NEXT HOLDINGSLtd better if we see some big insider buys. While we wait, check out this free list of undervalued stocks (mostly small caps) with considerable, recent, insider buying.
Please note, the market returns quoted in this article reflect the market weighted average returns of stocks that currently trade on Japanese exchanges.
If you're looking to trade U-NEXT HOLDINGSLtd, open an account with the lowest-cost platform trusted by professionals, Interactive Brokers.
With clients in over 200 countries and territories, and access to 160 markets, IBKR lets you trade stocks, options, futures, forex, bonds and funds from a single integrated account.
Enjoy no hidden fees, no account minimums, and FX conversion rates as low as 0.03%, far better than what most brokers offer.
Sponsored ContentNew: AI Stock Screener & Alerts
Our new AI Stock Screener scans the market every day to uncover opportunities.
• Dividend Powerhouses (3%+ Yield)
• Undervalued Small Caps with Insider Buying
• High growth Tech and AI Companies
Or build your own from over 50 metrics.
Have feedback on this article? Concerned about the content? Get in touch with us directly. Alternatively, email editorial-team (at) simplywallst.com.
This article by Simply Wall St is general in nature. We provide commentary based on historical data and analyst forecasts only using an unbiased methodology and our articles are not intended to be financial advice. It does not constitute a recommendation to buy or sell any stock, and does not take account of your objectives, or your financial situation. We aim to bring you long-term focused analysis driven by fundamental data. Note that our analysis may not factor in the latest price-sensitive company announcements or qualitative material. Simply Wall St has no position in any stocks mentioned.
About TSE:9418
Flawless balance sheet with solid track record.
