Advertisement
3 Japanese Exchange Stocks That May Be Undervalued In October 2024

Simply Wall St
Reviewed by Simply Wall St

As Japan's stock markets experience fluctuations amidst political changes and a new prime minister, investors are keenly observing potential opportunities in the region. With the Nikkei 225 and TOPIX indices showing recent declines, some stocks might be trading below their intrinsic value, presenting potential opportunities for discerning investors. Identifying undervalued stocks often involves looking at companies with strong fundamentals that may be temporarily overlooked due to broader market sentiments or geopolitical developments.
Top 10 Undervalued Stocks Based On Cash Flows In Japan
| Name | Current Price | Fair Value (Est) | Discount (Est) |
| Densan System Holdings (TSE:4072) | ¥2679.00 | ¥5306.56 | 49.5% |
| Hagiwara Electric Holdings (TSE:7467) | ¥3430.00 | ¥6696.82 | 48.8% |
| Kotobuki Spirits (TSE:2222) | ¥1825.00 | ¥3434.73 | 46.9% |
| Stella Chemifa (TSE:4109) | ¥4400.00 | ¥8121.15 | 45.8% |
| Pilot (TSE:7846) | ¥4649.00 | ¥8896.31 | 47.7% |
| Hibino (TSE:2469) | ¥3590.00 | ¥6964.82 | 48.5% |
| KeePer Technical Laboratory (TSE:6036) | ¥4280.00 | ¥7851.31 | 45.5% |
| BayCurrent Consulting (TSE:6532) | ¥5193.00 | ¥9500.41 | 45.3% |
| freee K.K (TSE:4478) | ¥3225.00 | ¥6064.00 | 46.8% |
| Money Forward (TSE:3994) | ¥5914.00 | ¥11782.73 | 49.8% |
Let's take a closer look at a couple of our picks from the screened companies.
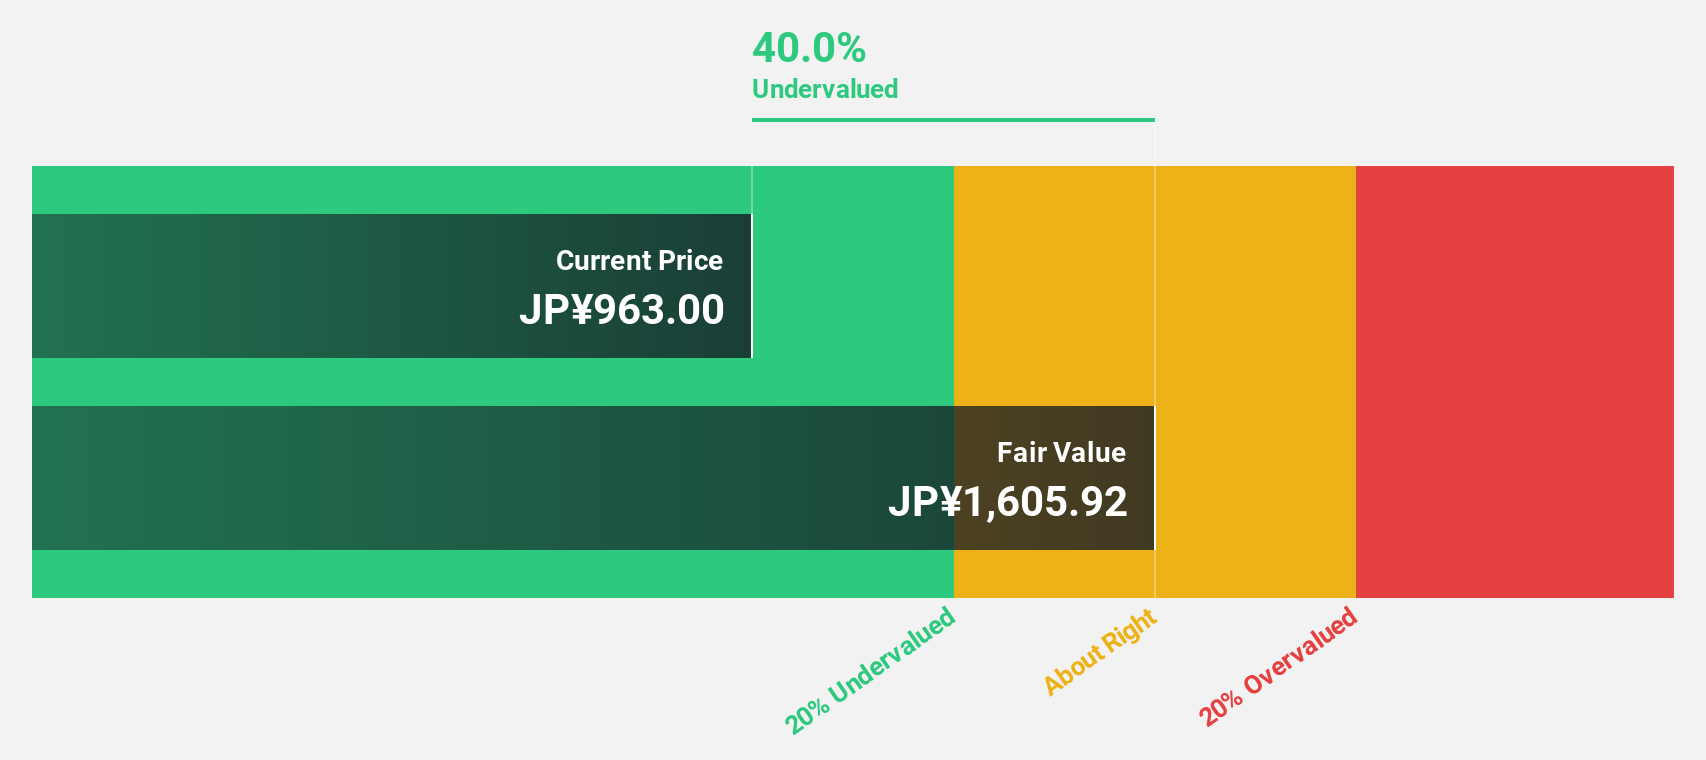
Infomart (TSE:2492)
Overview: Infomart Corporation operates an online BtoB EC trading platform for the food industry in Japan, with a market cap of ¥79.66 billion.
Operations: The company's revenue segments include ¥5.52 billion from B2B-PFES and ¥8.79 billion from B to B-PF FOOD.
Estimated Discount To Fair Value: 43%
Infomart is trading at ¥352, significantly below its fair value estimate of ¥617.6, indicating it may be undervalued based on cash flows. Earnings are forecast to grow at 39.1% annually, outpacing the broader Japanese market's growth rate of 8.7%. Despite a volatile share price recently, Infomart's revenue is expected to increase by 11.2% per year, surpassing the market average of 4.2%, with a high projected return on equity of 20.7% in three years.
- Our earnings growth report unveils the potential for significant increases in Infomart's future results.
- Click to explore a detailed breakdown of our findings in Infomart's balance sheet health report.
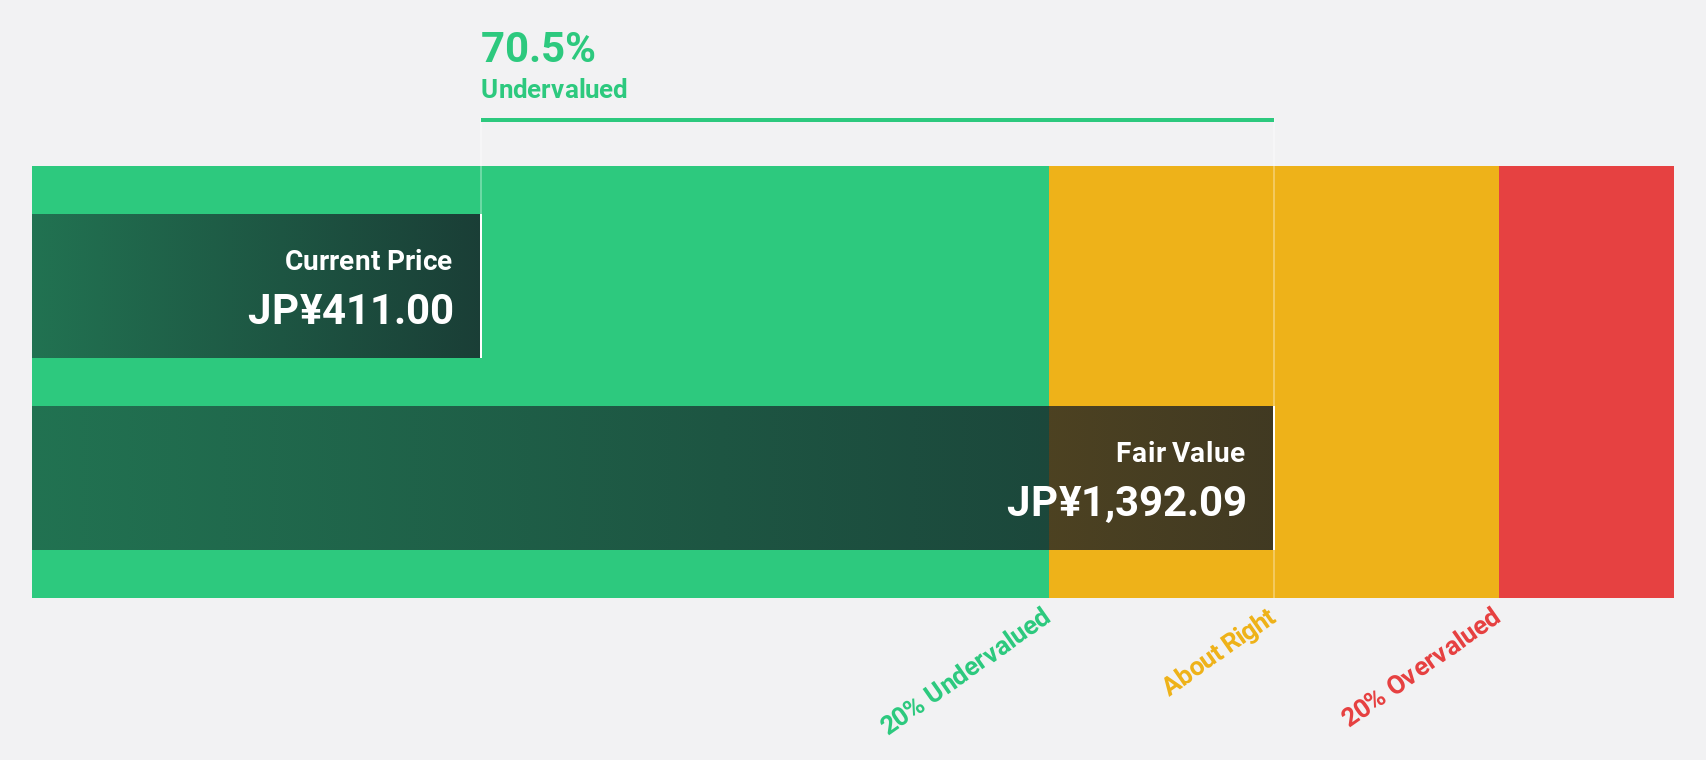
Mercari (TSE:4385)
Overview: Mercari, Inc. develops and operates marketplace applications in Japan and the United States, with a market cap of ¥411.60 billion.
Operations: The company's revenue segments include ¥43.65 billion from the United States and ¥138.11 billion from Japan.
Estimated Discount To Fair Value: 43%
Mercari is trading at ¥2,510.5, significantly below its fair value estimate of ¥4,403.08, suggesting undervaluation based on cash flows. Despite a volatile share price recently, earnings are forecast to grow at 17.74% annually, outpacing the Japanese market's 8.7% growth rate. Revenue growth is projected at 6.9%, higher than the market average of 4.2%. The company anticipates revenue between ¥200 billion and ¥210 billion for fiscal year ending June 2025.
- In light of our recent growth report, it seems possible that Mercari's financial performance will exceed current levels.
- Navigate through the intricacies of Mercari with our comprehensive financial health report here.
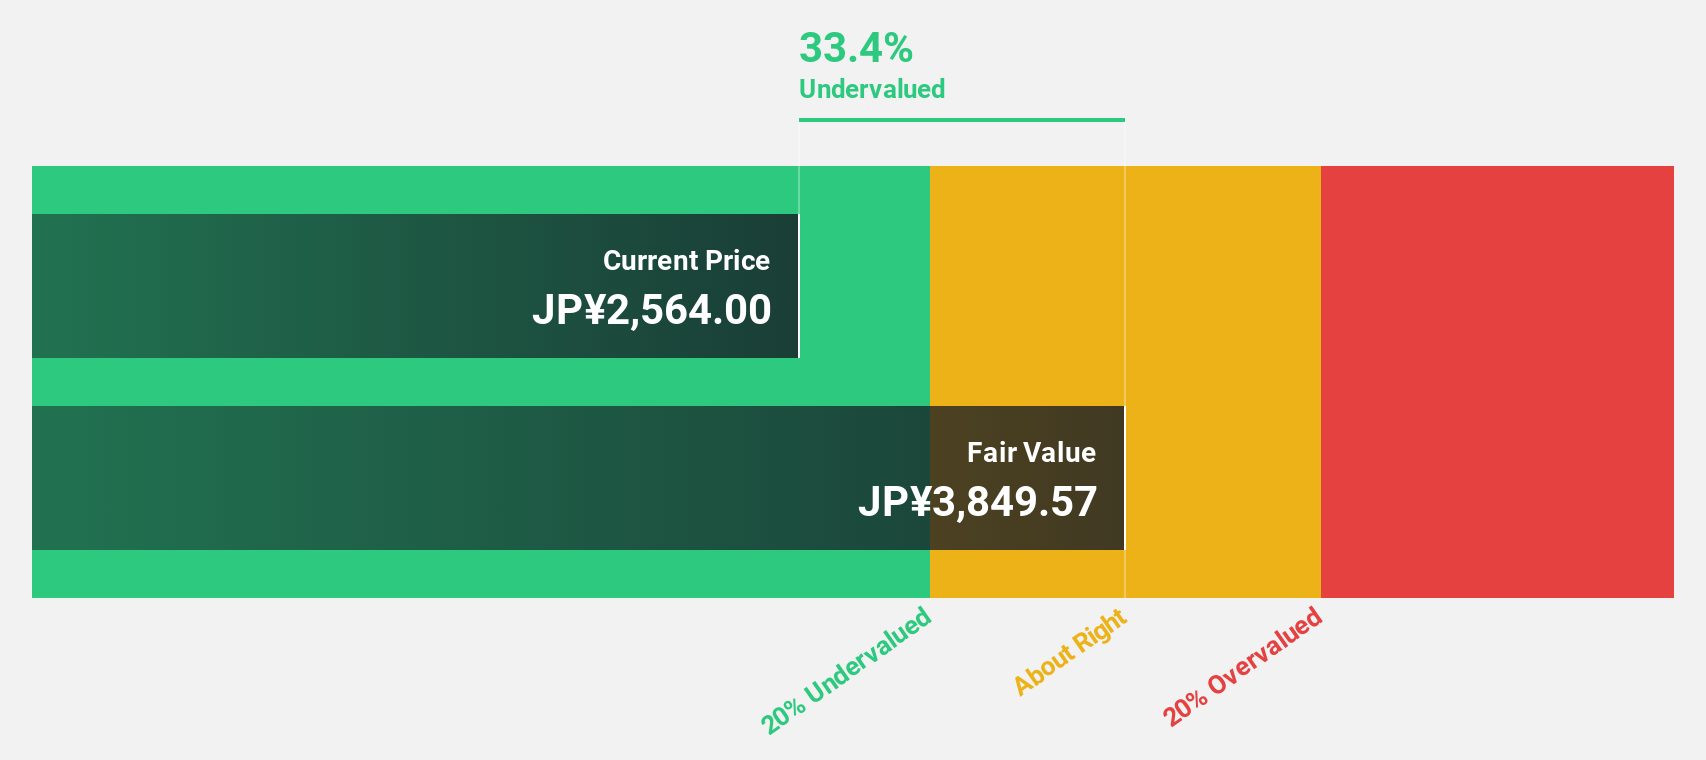
Insource (TSE:6200)
Overview: Insource Co., Ltd. operates in Japan, offering lecturer dispatch training and open lecture services, with a market cap of ¥88.43 billion.
Operations: The company's revenue primarily comes from its Education Service Business, which generated ¥12.06 billion.
Estimated Discount To Fair Value: 34.1%
Insource is trading at ¥1,054, well below its fair value estimate of ¥1,599.13. Earnings are projected to grow at 18.6% annually, surpassing the Japanese market's average growth rate of 8.7%. Revenue is expected to increase by 14.9% per year, also ahead of the market's 4.2%. Recent board changes and expansion with a new office in Gunma highlight strategic growth initiatives amidst an unstable dividend history.
- Our expertly prepared growth report on Insource implies its future financial outlook may be stronger than recent results.
- Dive into the specifics of Insource here with our thorough financial health report.
Where To Now?
- Click this link to deep-dive into the 78 companies within our Undervalued Japanese Stocks Based On Cash Flows screener.
- Have a stake in these businesses? Integrate your holdings into Simply Wall St's portfolio for notifications and detailed stock reports.
- Invest smarter with the free Simply Wall St app providing detailed insights into every stock market around the globe.
Seeking Other Investments?
- Explore high-performing small cap companies that haven't yet garnered significant analyst attention.
- Diversify your portfolio with solid dividend payers offering reliable income streams to weather potential market turbulence.
- Fuel your portfolio with companies showing strong growth potential, backed by optimistic outlooks both from analysts and management.
This article by Simply Wall St is general in nature. We provide commentary based on historical data and analyst forecasts only using an unbiased methodology and our articles are not intended to be financial advice. It does not constitute a recommendation to buy or sell any stock, and does not take account of your objectives, or your financial situation. We aim to bring you long-term focused analysis driven by fundamental data. Note that our analysis may not factor in the latest price-sensitive company announcements or qualitative material. Simply Wall St has no position in any stocks mentioned.
New: Manage All Your Stock Portfolios in One Place
We've created the ultimate portfolio companion for stock investors, and it's free.
• Connect an unlimited number of Portfolios and see your total in one currency
• Be alerted to new Warning Signs or Risks via email or mobile
• Track the Fair Value of your stocks
Have feedback on this article? Concerned about the content? Get in touch with us directly. Alternatively, email editorial-team@simplywallst.com
About TSE:4385
Mercari
Plans, develops, and operates Mercari marketplace applications in Japan and the United States.
Adequate balance sheet with moderate growth potential.
Similar Companies
Market Insights

Advertisement
Community Narratives
Pinterest will surge as advertising innovations ignite revenue growth
Fair Value US$42.63|26.3% undervalued
BR
Community Contributor
Brambles' Revenue Set to Climb 14% with Profit Margins Following
Fair Value AU$21.90|4.8% overvalued
RO
Community Contributor
Challenging Future for STG as Organic Sales Decline by 8.8%
Fair Value DKK 116.13|26.8% undervalued
KA
Community Contributor