- Japan
- /
- Metals and Mining
- /
- TSE:5727
The total return for Toho Titanium (TSE:5727) investors has risen faster than earnings growth over the last five years


Toho Titanium Co., Ltd. (TSE:5727) shareholders might be concerned after seeing the share price drop 17% in the last quarter. On the bright side the share price is up over the last half decade. However we are not very impressed because the share price is only up 58%, less than the market return of 85%. While the long term returns are impressive, we do have some sympathy for those who bought more recently, given the 36% drop, in the last year.
While this past week has detracted from the company's five-year return, let's look at the recent trends of the underlying business and see if the gains have been in alignment.
View our latest analysis for Toho Titanium
To quote Buffett, 'Ships will sail around the world but the Flat Earth Society will flourish. There will continue to be wide discrepancies between price and value in the marketplace...' One flawed but reasonable way to assess how sentiment around a company has changed is to compare the earnings per share (EPS) with the share price.
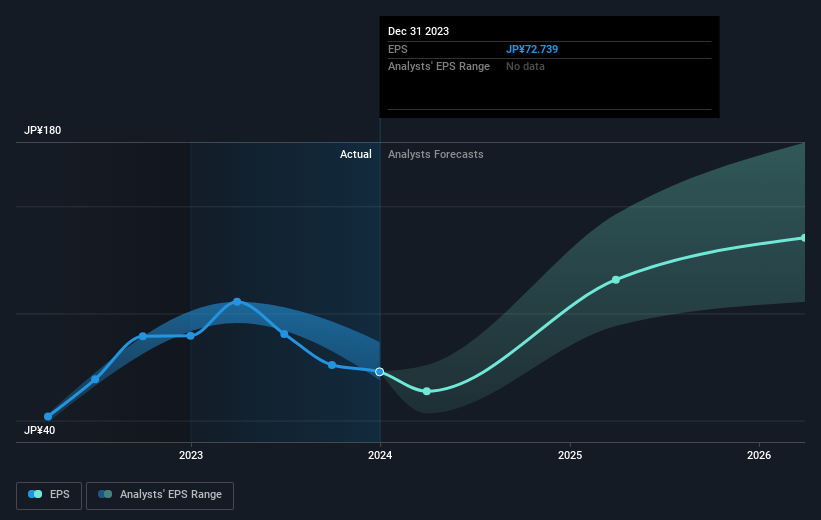
During five years of share price growth, Toho Titanium achieved compound earnings per share (EPS) growth of 3.3% per year. This EPS growth is lower than the 10% average annual increase in the share price. So it's fair to assume the market has a higher opinion of the business than it did five years ago. That's not necessarily surprising considering the five-year track record of earnings growth.
The graphic below depicts how EPS has changed over time (unveil the exact values by clicking on the image).
It is of course excellent to see how Toho Titanium has grown profits over the years, but the future is more important for shareholders. This free interactive report on Toho Titanium's balance sheet strength is a great place to start, if you want to investigate the stock further.
What About Dividends?
It is important to consider the total shareholder return, as well as the share price return, for any given stock. Whereas the share price return only reflects the change in the share price, the TSR includes the value of dividends (assuming they were reinvested) and the benefit of any discounted capital raising or spin-off. So for companies that pay a generous dividend, the TSR is often a lot higher than the share price return. We note that for Toho Titanium the TSR over the last 5 years was 69%, which is better than the share price return mentioned above. This is largely a result of its dividend payments!
A Different Perspective
While the broader market gained around 35% in the last year, Toho Titanium shareholders lost 36% (even including dividends). Even the share prices of good stocks drop sometimes, but we want to see improvements in the fundamental metrics of a business, before getting too interested. On the bright side, long term shareholders have made money, with a gain of 11% per year over half a decade. If the fundamental data continues to indicate long term sustainable growth, the current sell-off could be an opportunity worth considering. I find it very interesting to look at share price over the long term as a proxy for business performance. But to truly gain insight, we need to consider other information, too. Consider for instance, the ever-present spectre of investment risk. We've identified 1 warning sign with Toho Titanium , and understanding them should be part of your investment process.
We will like Toho Titanium better if we see some big insider buys. While we wait, check out this free list of growing companies with considerable, recent, insider buying.
Please note, the market returns quoted in this article reflect the market weighted average returns of stocks that currently trade on Japanese exchanges.
Valuation is complex, but we're here to simplify it.
Discover if Toho Titanium might be undervalued or overvalued with our detailed analysis, featuring fair value estimates, potential risks, dividends, insider trades, and its financial condition.
Access Free AnalysisHave feedback on this article? Concerned about the content? Get in touch with us directly. Alternatively, email editorial-team (at) simplywallst.com.
This article by Simply Wall St is general in nature. We provide commentary based on historical data and analyst forecasts only using an unbiased methodology and our articles are not intended to be financial advice. It does not constitute a recommendation to buy or sell any stock, and does not take account of your objectives, or your financial situation. We aim to bring you long-term focused analysis driven by fundamental data. Note that our analysis may not factor in the latest price-sensitive company announcements or qualitative material. Simply Wall St has no position in any stocks mentioned.
About TSE:5727
Toho Titanium
Engages in the manufacture and sale of titanium metals, catalysts for polyolefin, and chemicals in Japan.
Adequate balance sheet and slightly overvalued.
