
The external fund manager backed by Berkshire Hathaway's Charlie Munger, Li Lu, makes no bones about it when he says 'The biggest investment risk is not the volatility of prices, but whether you will suffer a permanent loss of capital.' When we think about how risky a company is, we always like to look at its use of debt, since debt overload can lead to ruin. We can see that CESC Limited (NSE:CESC) does use debt in its business. But the more important question is: how much risk is that debt creating?
What Risk Does Debt Bring?
Debt assists a business until the business has trouble paying it off, either with new capital or with free cash flow. Part and parcel of capitalism is the process of 'creative destruction' where failed businesses are mercilessly liquidated by their bankers. While that is not too common, we often do see indebted companies permanently diluting shareholders because lenders force them to raise capital at a distressed price. Of course, the upside of debt is that it often represents cheap capital, especially when it replaces dilution in a company with the ability to reinvest at high rates of return. When we examine debt levels, we first consider both cash and debt levels, together.
How Much Debt Does CESC Carry?
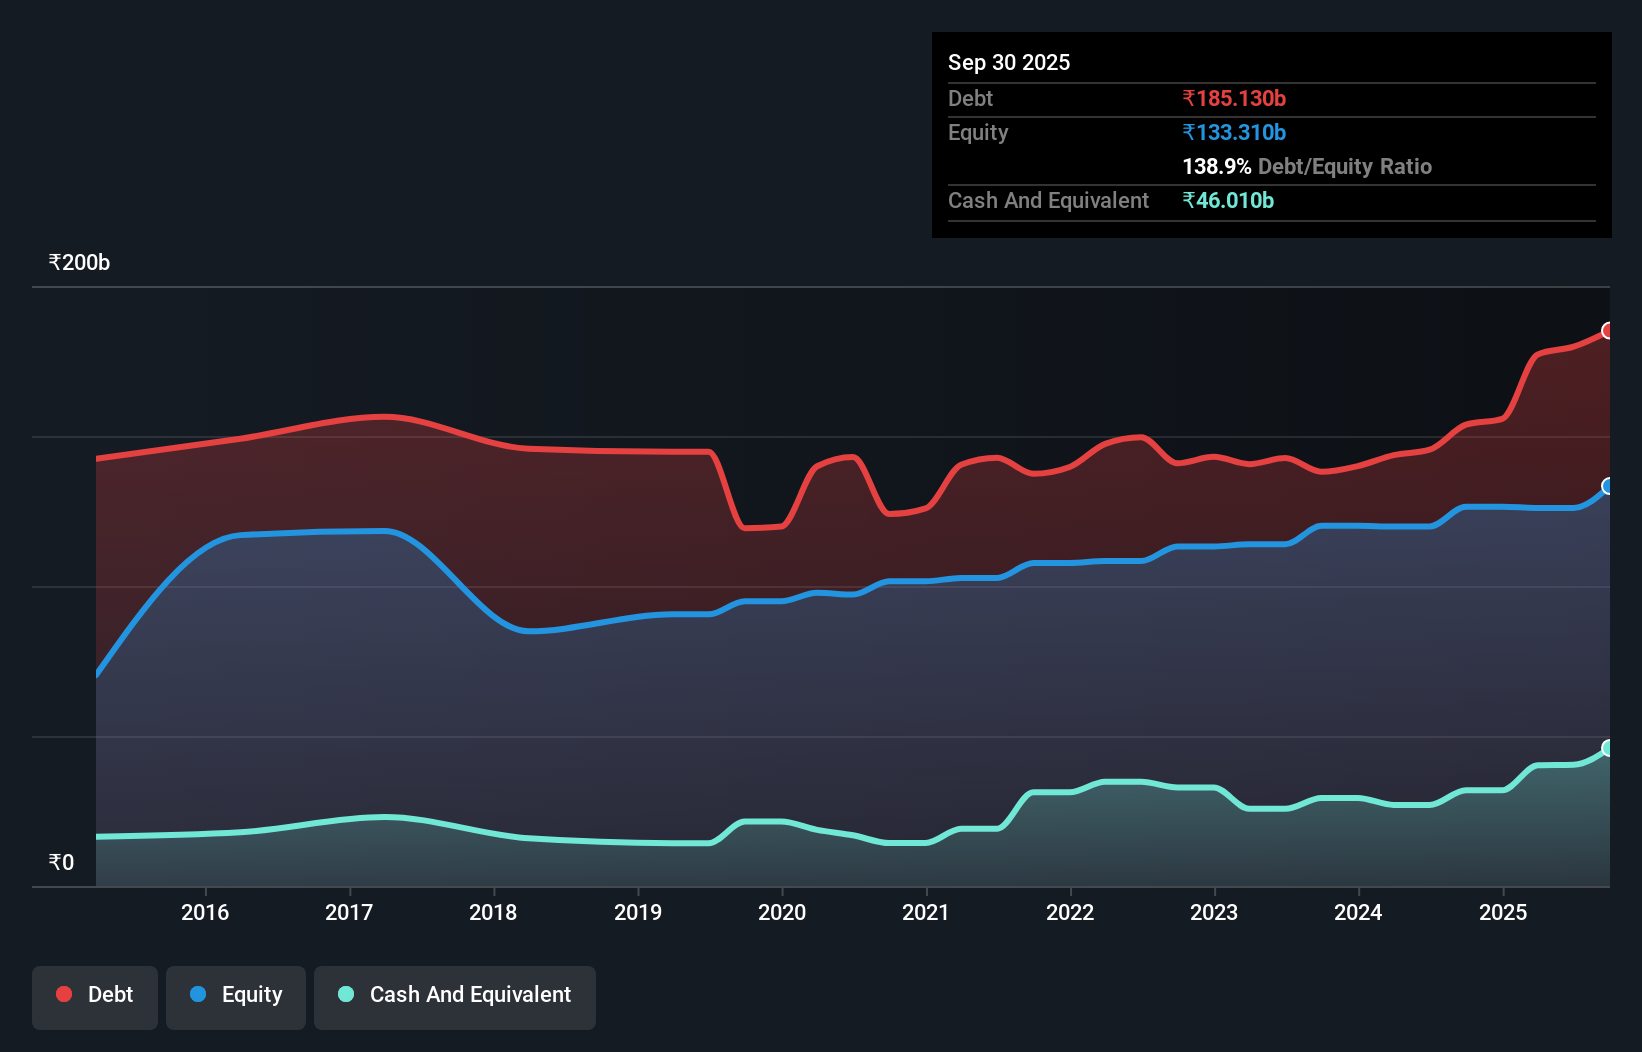
As you can see below, at the end of September 2025, CESC had ₹185.1b of debt, up from ₹153.8b a year ago. Click the image for more detail. However, it does have ₹46.0b in cash offsetting this, leading to net debt of about ₹139.1b.
A Look At CESC's Liabilities
Zooming in on the latest balance sheet data, we can see that CESC had liabilities of ₹90.7b due within 12 months and liabilities of ₹207.9b due beyond that. On the other hand, it had cash of ₹46.0b and ₹30.2b worth of receivables due within a year. So it has liabilities totalling ₹222.3b more than its cash and near-term receivables, combined.
This deficit is considerable relative to its market capitalization of ₹225.4b, so it does suggest shareholders should keep an eye on CESC's use of debt. This suggests shareholders would be heavily diluted if the company needed to shore up its balance sheet in a hurry.
View our latest analysis for CESC
We use two main ratios to inform us about debt levels relative to earnings. The first is net debt divided by earnings before interest, tax, depreciation, and amortization (EBITDA), while the second is how many times its earnings before interest and tax (EBIT) covers its interest expense (or its interest cover, for short). This way, we consider both the absolute quantum of the debt, as well as the interest rates paid on it.
While CESC's debt to EBITDA ratio (4.0) suggests that it uses some debt, its interest cover is very weak, at 1.7, suggesting high leverage. So shareholders should probably be aware that interest expenses appear to have really impacted the business lately. However, it should be some comfort for shareholders to recall that CESC actually grew its EBIT by a hefty 137%, over the last 12 months. If it can keep walking that path it will be in a position to shed its debt with relative ease. When analysing debt levels, the balance sheet is the obvious place to start. But ultimately the future profitability of the business will decide if CESC can strengthen its balance sheet over time. So if you're focused on the future you can check out this free report showing analyst profit forecasts.
Finally, a company can only pay off debt with cold hard cash, not accounting profits. So it's worth checking how much of that EBIT is backed by free cash flow. During the last three years, CESC produced sturdy free cash flow equating to 78% of its EBIT, about what we'd expect. This free cash flow puts the company in a good position to pay down debt, when appropriate.
Our View
Both CESC's ability to to grow its EBIT and its conversion of EBIT to free cash flow gave us comfort that it can handle its debt. In contrast, our confidence was undermined by its apparent struggle to cover its interest expense with its EBIT. It's also worth noting that CESC is in the Electric Utilities industry, which is often considered to be quite defensive. Looking at all this data makes us feel a little cautious about CESC's debt levels. While we appreciate debt can enhance returns on equity, we'd suggest that shareholders keep close watch on its debt levels, lest they increase. When analysing debt levels, the balance sheet is the obvious place to start. But ultimately, every company can contain risks that exist outside of the balance sheet. For example - CESC has 1 warning sign we think you should be aware of.
If, after all that, you're more interested in a fast growing company with a rock-solid balance sheet, then check out our list of net cash growth stocks without delay.
Mobile Infrastructure for Defense and Disaster
The next wave in robotics isn't humanoid. Its fully autonomous towers delivering 5G, ISR, and radar in under 30 minutes, anywhere.
Get the investor briefing before the next round of contracts
Sponsored On Behalf of CiTechNew: AI Stock Screener & Alerts
Our new AI Stock Screener scans the market every day to uncover opportunities.
• Dividend Powerhouses (3%+ Yield)
• Undervalued Small Caps with Insider Buying
• High growth Tech and AI Companies
Or build your own from over 50 metrics.
Have feedback on this article? Concerned about the content? Get in touch with us directly. Alternatively, email editorial-team (at) simplywallst.com.
This article by Simply Wall St is general in nature. We provide commentary based on historical data and analyst forecasts only using an unbiased methodology and our articles are not intended to be financial advice. It does not constitute a recommendation to buy or sell any stock, and does not take account of your objectives, or your financial situation. We aim to bring you long-term focused analysis driven by fundamental data. Note that our analysis may not factor in the latest price-sensitive company announcements or qualitative material. Simply Wall St has no position in any stocks mentioned.
About NSEI:CESC
CESC
An integrated electrical utility company, engages in the generation and distribution of electricity in India.
6 star dividend payer and good value.
Similar Companies
Market Insights

Weekly Picks

THE KINGDOM OF BROWN GOODS: WHY MGPI IS BEING CRUSHED BY INVENTORY & PRIMED FOR RESURRECTION


Why Vertical Aerospace (NYSE: EVTL) is Worth Possibly Over 13x its Current Price


The Quiet Giant That Became AI’s Power Grid
Recently Updated Narratives

Butler National (Buks) outperforms.


A tech powerhouse quietly powering the world’s AI infrastructure.


Keppel DC REIT (SGX: AJBU) is a resilient gem in the data center space.
Popular Narratives

MicroVision will explode future revenue by 380.37% with a vision towards success


Crazy Undervalued 42 Baggers Silver Play (Active & Running Mine)


