If You Had Bought Xelpmoc Design and Tech (NSE:XELPMOC) Shares A Year Ago You'd Have Earned 419% Returns

While some are satisfied with an index fund, active investors aim to find truly magnificent investments on the stock market. When an investor finds a multi-bagger (a stock that goes up over 200%), it makes a big difference to their portfolio. For example, the Xelpmoc Design and Tech Limited (NSE:XELPMOC) share price rocketed moonwards 419% in just one year. Also pleasing for shareholders was the 15% gain in the last three months. But this move may well have been assisted by the reasonably buoyant market (up 22% in 90 days). Xelpmoc Design and Tech hasn't been listed for long, so it's still not clear if it is a long term winner.
Check out our latest analysis for Xelpmoc Design and Tech
While the efficient markets hypothesis continues to be taught by some, it has been proven that markets are over-reactive dynamic systems, and investors are not always rational. By comparing earnings per share (EPS) and share price changes over time, we can get a feel for how investor attitudes to a company have morphed over time.
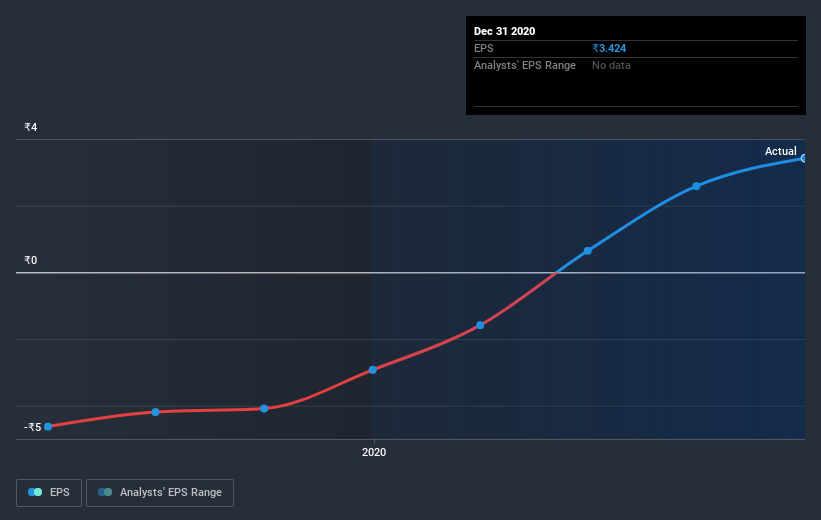
During the last year Xelpmoc Design and Tech grew its earnings per share, moving from a loss to a profit.
While it's good to see positive EPS of ₹3.42 this year, the loss wasn't too bad last year. But judging by the share price, the market is very pleased with the milestone of reaching profitability. Inflection points like this can be a great time to take a closer look at a company.
The graphic below depicts how EPS has changed over time (unveil the exact values by clicking on the image).
We're pleased to report that the CEO is remunerated more modestly than most CEOs at similarly capitalized companies. It's always worth keeping an eye on CEO pay, but a more important question is whether the company will grow earnings throughout the years. It might be well worthwhile taking a look at our free report on Xelpmoc Design and Tech's earnings, revenue and cash flow.
A Different Perspective
Xelpmoc Design and Tech boasts a total shareholder return of 419% for the last year. The more recent returns haven't been as impressive as the longer term returns, coming in at just 15%. Having said that, we doubt shareholders would be concerned. It seems the market is simply waiting on more information, because if the business delivers so will the share price (eventually). While it is well worth considering the different impacts that market conditions can have on the share price, there are other factors that are even more important. For instance, we've identified 3 warning signs for Xelpmoc Design and Tech that you should be aware of.
Of course Xelpmoc Design and Tech may not be the best stock to buy. So you may wish to see this free collection of growth stocks.
Please note, the market returns quoted in this article reflect the market weighted average returns of stocks that currently trade on IN exchanges.
When trading Xelpmoc Design and Tech or any other investment, use the platform considered by many to be the Professional's Gateway to the Worlds Market, Interactive Brokers. You get the lowest-cost* trading on stocks, options, futures, forex, bonds and funds worldwide from a single integrated account. Promoted
The New Payments ETF Is Live on NASDAQ:
Money is moving to real-time rails, and a newly listed ETF now gives investors direct exposure. Fast settlement. Institutional custody. Simple access.
Explore how this launch could reshape portfolios
Sponsored ContentNew: AI Stock Screener & Alerts
Our new AI Stock Screener scans the market every day to uncover opportunities.
• Dividend Powerhouses (3%+ Yield)
• Undervalued Small Caps with Insider Buying
• High growth Tech and AI Companies
Or build your own from over 50 metrics.
This article by Simply Wall St is general in nature. It does not constitute a recommendation to buy or sell any stock, and does not take account of your objectives, or your financial situation. We aim to bring you long-term focused analysis driven by fundamental data. Note that our analysis may not factor in the latest price-sensitive company announcements or qualitative material. Simply Wall St has no position in any stocks mentioned.
*Interactive Brokers Rated Lowest Cost Broker by StockBrokers.com Annual Online Review 2020
Have feedback on this article? Concerned about the content? Get in touch with us directly. Alternatively, email editorial-team (at) simplywallst.com.
About NSEI:XELPMOC
Xelpmoc Design and Tech
Provides technical and expert consulting services to corporates, startups, and the government in India and internationally.
Flawless balance sheet with slight risk.
Market Insights

Weekly Picks

THE KINGDOM OF BROWN GOODS: WHY MGPI IS BEING CRUSHED BY INVENTORY & PRIMED FOR RESURRECTION


Why Vertical Aerospace (NYSE: EVTL) is Worth Possibly Over 13x its Current Price


The Quiet Giant That Became AI’s Power Grid
Recently Updated Narratives


Unicycive Therapeutics (Nasdaq: UNCY) – Preparing for a Second Shot at Bringing a New Kidney Treatment to Market (TEST)

Rocket Lab USA Will Ignite a 30% Revenue Growth Journey


Dollar general to grow
Popular Narratives


MicroVision will explode future revenue by 380.37% with a vision towards success


NVDA: Expanding AI Demand Will Drive Major Data Center Investments Through 2026


Crazy Undervalued 42 Baggers Silver Play (Active & Running Mine)
Trending Discussion