
Advertisement
- Hong Kong
- /
- Construction
- /
- SEHK:1556
Our Take On The Returns On Capital At Chinney Kin Wing Holdings (HKG:1556)

What are the early trends we should look for to identify a stock that could multiply in value over the long term? In a perfect world, we'd like to see a company investing more capital into its business and ideally the returns earned from that capital are also increasing. If you see this, it typically means it's a company with a great business model and plenty of profitable reinvestment opportunities. However, after investigating Chinney Kin Wing Holdings (HKG:1556), we don't think it's current trends fit the mold of a multi-bagger.
Return On Capital Employed (ROCE): What is it?
Just to clarify if you're unsure, ROCE is a metric for evaluating how much pre-tax income (in percentage terms) a company earns on the capital invested in its business. To calculate this metric for Chinney Kin Wing Holdings, this is the formula:
Return on Capital Employed = Earnings Before Interest and Tax (EBIT) ÷ (Total Assets - Current Liabilities)
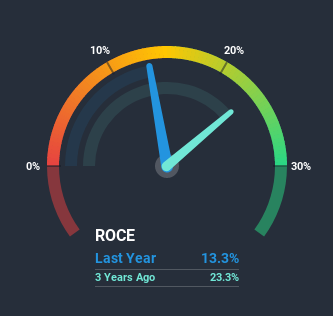
0.13 = HK$67m ÷ (HK$871m - HK$367m) (Based on the trailing twelve months to June 2020).
So, Chinney Kin Wing Holdings has an ROCE of 13%. In absolute terms, that's a satisfactory return, but compared to the Construction industry average of 10% it's much better.
See our latest analysis for Chinney Kin Wing Holdings
While the past is not representative of the future, it can be helpful to know how a company has performed historically, which is why we have this chart above. If you want to delve into the historical earnings, revenue and cash flow of Chinney Kin Wing Holdings, check out these free graphs here.
So How Is Chinney Kin Wing Holdings' ROCE Trending?
When we looked at the ROCE trend at Chinney Kin Wing Holdings, we didn't gain much confidence. To be more specific, ROCE has fallen from 44% over the last five years. However, given capital employed and revenue have both increased it appears that the business is currently pursuing growth, at the consequence of short term returns. If these investments prove successful, this can bode very well for long term stock performance.
On a related note, Chinney Kin Wing Holdings has decreased its current liabilities to 42% of total assets. That could partly explain why the ROCE has dropped. What's more, this can reduce some aspects of risk to the business because now the company's suppliers or short-term creditors are funding less of its operations. Since the business is basically funding more of its operations with it's own money, you could argue this has made the business less efficient at generating ROCE. Keep in mind 42% is still pretty high, so those risks are still somewhat prevalent.The Key Takeaway
In summary, despite lower returns in the short term, we're encouraged to see that Chinney Kin Wing Holdings is reinvesting for growth and has higher sales as a result. And there could be an opportunity here if other metrics look good too, because the stock has declined 24% in the last five years. So we think it'd be worthwhile to look further into this stock given the trends look encouraging.
If you want to know some of the risks facing Chinney Kin Wing Holdings we've found 3 warning signs (1 can't be ignored!) that you should be aware of before investing here.
For those who like to invest in solid companies, check out this free list of companies with solid balance sheets and high returns on equity.
If you’re looking to trade Chinney Kin Wing Holdings, open an account with the lowest-cost* platform trusted by professionals, Interactive Brokers. Their clients from over 200 countries and territories trade stocks, options, futures, forex, bonds and funds worldwide from a single integrated account. Promoted
New: AI Stock Screener & Alerts
Our new AI Stock Screener scans the market every day to uncover opportunities.
• Dividend Powerhouses (3%+ Yield)
• Undervalued Small Caps with Insider Buying
• High growth Tech and AI Companies
Or build your own from over 50 metrics.
This article by Simply Wall St is general in nature. It does not constitute a recommendation to buy or sell any stock, and does not take account of your objectives, or your financial situation. We aim to bring you long-term focused analysis driven by fundamental data. Note that our analysis may not factor in the latest price-sensitive company announcements or qualitative material. Simply Wall St has no position in any stocks mentioned.
*Interactive Brokers Rated Lowest Cost Broker by StockBrokers.com Annual Online Review 2020
Have feedback on this article? Concerned about the content? Get in touch with us directly. Alternatively, email editorial-team (at) simplywallst.com.
About SEHK:1556
Chinney Kin Wing Holdings
An investment holding company, engages in foundation construction, and drilling and site investigation works for public and private sectors in Hong Kong.
Flawless balance sheet and good value.
Similar Companies
Market Insights

Advertisement
Community Narratives
RIO is poised to weather a depressed iron ore environment, but commodity diversification comes with lower margins
Fair Value AU$110.51|3.0% overvalued
DU
Community Contributor
The demand for personalized medicine will keep Thermo Fisher Scientific thriving
Fair Value US$540.27|19.5% undervalued
UN
Community Contributor
Silver Play by A Family with 10x Potential
Fair Value UK£24.00|87.3% undervalued
RO
Community Contributor