- United Kingdom
- /
- Software
- /
- AIM:OMG
Oxford Metrics plc's (LON:OMG) On An Uptrend But Financial Prospects Look Pretty Weak: Is The Stock Overpriced?

Oxford Metrics (LON:OMG) has had a great run on the share market with its stock up by a significant 16% over the last three months. However, we decided to pay close attention to its weak financials as we are doubtful that the current momentum will keep up, given the scenario. In this article, we decided to focus on Oxford Metrics' ROE.
Return on equity or ROE is an important factor to be considered by a shareholder because it tells them how effectively their capital is being reinvested. Put another way, it reveals the company's success at turning shareholder investments into profits.
Check out our latest analysis for Oxford Metrics
How Is ROE Calculated?
The formula for return on equity is:
Return on Equity = Net Profit (from continuing operations) ÷ Shareholders' Equity
So, based on the above formula, the ROE for Oxford Metrics is:
5.2% = UK£1.6m ÷ UK£31m (Based on the trailing twelve months to September 2020).
The 'return' is the profit over the last twelve months. So, this means that for every £1 of its shareholder's investments, the company generates a profit of £0.05.
What Has ROE Got To Do With Earnings Growth?
So far, we've learned that ROE is a measure of a company's profitability. Based on how much of its profits the company chooses to reinvest or "retain", we are then able to evaluate a company's future ability to generate profits. Generally speaking, other things being equal, firms with a high return on equity and profit retention, have a higher growth rate than firms that don’t share these attributes.
A Side By Side comparison of Oxford Metrics' Earnings Growth And 5.2% ROE
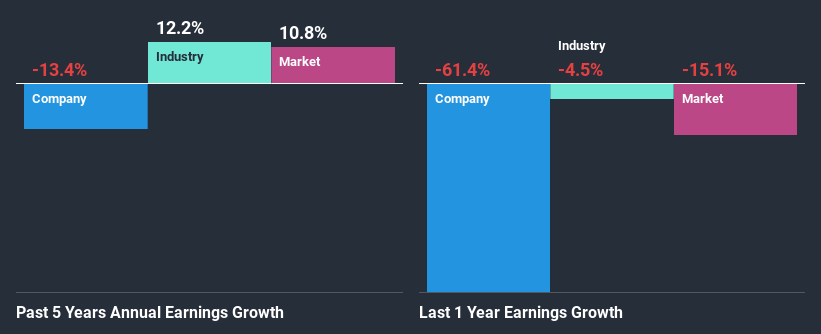
On the face of it, Oxford Metrics' ROE is not much to talk about. We then compared the company's ROE to the broader industry and were disappointed to see that the ROE is lower than the industry average of 8.3%. For this reason, Oxford Metrics' five year net income decline of 13% is not surprising given its lower ROE. We believe that there also might be other aspects that are negatively influencing the company's earnings prospects. Such as - low earnings retention or poor allocation of capital.
However, when we compared Oxford Metrics' growth with the industry we found that while the company's earnings have been shrinking, the industry has seen an earnings growth of 12% in the same period. This is quite worrisome.
Earnings growth is a huge factor in stock valuation. It’s important for an investor to know whether the market has priced in the company's expected earnings growth (or decline). By doing so, they will have an idea if the stock is headed into clear blue waters or if swampy waters await. One good indicator of expected earnings growth is the P/E ratio which determines the price the market is willing to pay for a stock based on its earnings prospects. So, you may want to check if Oxford Metrics is trading on a high P/E or a low P/E, relative to its industry.
Is Oxford Metrics Making Efficient Use Of Its Profits?
Oxford Metrics has a high three-year median payout ratio of 54% (that is, it is retaining 46% of its profits). This suggests that the company is paying most of its profits as dividends to its shareholders. This goes some way in explaining why its earnings have been shrinking. With only a little being reinvested into the business, earnings growth would obviously be low or non-existent. To know the 3 risks we have identified for Oxford Metrics visit our risks dashboard for free.
In addition, Oxford Metrics has been paying dividends over a period of at least ten years suggesting that keeping up dividend payments is way more important to the management even if it comes at the cost of business growth. Upon studying the latest analysts' consensus data, we found that the company's future payout ratio is expected to rise to 65% over the next three years.
Conclusion
On the whole, Oxford Metrics' performance is quite a big let-down. As a result of its low ROE and lack of mich reinvestment into the business, the company has seen a disappointing earnings growth rate. Up till now, we've only made a short study of the company's growth data. You can do your own research on Oxford Metrics and see how it has performed in the past by looking at this FREE detailed graph of past earnings, revenue and cash flows.
When trading Oxford Metrics or any other investment, use the platform considered by many to be the Professional's Gateway to the Worlds Market, Interactive Brokers. You get the lowest-cost* trading on stocks, options, futures, forex, bonds and funds worldwide from a single integrated account. Promoted
The New Payments ETF Is Live on NASDAQ:
Money is moving to real-time rails, and a newly listed ETF now gives investors direct exposure. Fast settlement. Institutional custody. Simple access.
Explore how this launch could reshape portfolios
Sponsored ContentNew: AI Stock Screener & Alerts
Our new AI Stock Screener scans the market every day to uncover opportunities.
• Dividend Powerhouses (3%+ Yield)
• Undervalued Small Caps with Insider Buying
• High growth Tech and AI Companies
Or build your own from over 50 metrics.
This article by Simply Wall St is general in nature. It does not constitute a recommendation to buy or sell any stock, and does not take account of your objectives, or your financial situation. We aim to bring you long-term focused analysis driven by fundamental data. Note that our analysis may not factor in the latest price-sensitive company announcements or qualitative material. Simply Wall St has no position in any stocks mentioned.
*Interactive Brokers Rated Lowest Cost Broker by StockBrokers.com Annual Online Review 2020
Have feedback on this article? Concerned about the content? Get in touch with us directly. Alternatively, email editorial-team@simplywallst.com.
About AIM:OMG
Oxford Metrics
Operates as a smart sensing and software company in the United Kingdom.
Flawless balance sheet, undervalued and pays a dividend.
Market Insights

Weekly Picks

THE KINGDOM OF BROWN GOODS: WHY MGPI IS BEING CRUSHED BY INVENTORY & PRIMED FOR RESURRECTION


Why Vertical Aerospace (NYSE: EVTL) is Worth Possibly Over 13x its Current Price


The Quiet Giant That Became AI’s Power Grid
Recently Updated Narratives

Cheap if able to sustain revenue, and a potential bargain if able to turn store openings into revenue growth

Butler National (Buks) outperforms.


A tech powerhouse quietly powering the world’s AI infrastructure.
Popular Narratives


MicroVision will explode future revenue by 380.37% with a vision towards success


Crazy Undervalued 42 Baggers Silver Play (Active & Running Mine)


