Advertisement
- United Kingdom
- /
- Software
- /
- AIM:LOOP
How Much Did LoopUp Group's(LON:LOOP) Shareholders Earn From Share Price Movements Over The Last Three Years?
As every investor would know, not every swing hits the sweet spot. But you have a problem if you face massive losses more than once in a while. So take a moment to sympathize with the long term shareholders of LoopUp Group plc (LON:LOOP), who have seen the share price tank a massive 76% over a three year period. That might cause some serious doubts about the merits of the initial decision to buy the stock, to put it mildly. Furthermore, it's down 56% in about a quarter. That's not much fun for holders.
View our latest analysis for LoopUp Group
There is no denying that markets are sometimes efficient, but prices do not always reflect underlying business performance. One flawed but reasonable way to assess how sentiment around a company has changed is to compare the earnings per share (EPS) with the share price.
During the unfortunate three years of share price decline, LoopUp Group actually saw its earnings per share (EPS) improve by 60% per year. This is quite a puzzle, and suggests there might be something temporarily buoying the share price. Or else the company was over-hyped in the past, and so its growth has disappointed.
It's worth taking a look at other metrics, because the EPS growth doesn't seem to match with the falling share price.
We note that, in three years, revenue has actually grown at a 41% annual rate, so that doesn't seem to be a reason to sell shares. It's probably worth investigating LoopUp Group further; while we may be missing something on this analysis, there might also be an opportunity.
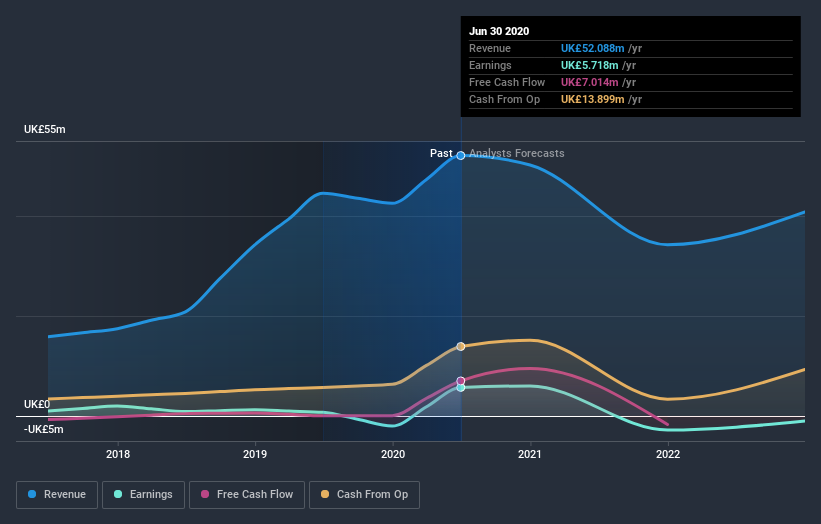
The company's revenue and earnings (over time) are depicted in the image below (click to see the exact numbers).
We know that LoopUp Group has improved its bottom line over the last three years, but what does the future have in store? You can see how its balance sheet has strengthened (or weakened) over time in this free interactive graphic.
A Different Perspective
The last twelve months weren't great for LoopUp Group shares, which performed worse than the market, costing holders 7.3%. Meanwhile, the broader market slid about 3.0%, likely weighing on the stock. Unfortunately, the longer term story isn't pretty, with investment losses running at 21% per year over three years. We'd need clear signs of growth in the underlying business before we could muster much enthusiasm for this one. I find it very interesting to look at share price over the long term as a proxy for business performance. But to truly gain insight, we need to consider other information, too. Even so, be aware that LoopUp Group is showing 3 warning signs in our investment analysis , and 1 of those doesn't sit too well with us...
If you like to buy stocks alongside management, then you might just love this free list of companies. (Hint: insiders have been buying them).
Please note, the market returns quoted in this article reflect the market weighted average returns of stocks that currently trade on GB exchanges.
When trading LoopUp Group or any other investment, use the platform considered by many to be the Professional's Gateway to the Worlds Market, Interactive Brokers. You get the lowest-cost* trading on stocks, options, futures, forex, bonds and funds worldwide from a single integrated account. Promoted
New: AI Stock Screener & Alerts
Our new AI Stock Screener scans the market every day to uncover opportunities.
• Dividend Powerhouses (3%+ Yield)
• Undervalued Small Caps with Insider Buying
• High growth Tech and AI Companies
Or build your own from over 50 metrics.
This article by Simply Wall St is general in nature. It does not constitute a recommendation to buy or sell any stock, and does not take account of your objectives, or your financial situation. We aim to bring you long-term focused analysis driven by fundamental data. Note that our analysis may not factor in the latest price-sensitive company announcements or qualitative material. Simply Wall St has no position in any stocks mentioned.
*Interactive Brokers Rated Lowest Cost Broker by StockBrokers.com Annual Online Review 2020
Have feedback on this article? Concerned about the content? Get in touch with us directly. Alternatively, email editorial-team (at) simplywallst.com.
About AIM:LOOP
LoopUp Group
Provides cloud communications platform for business-critical external and specialist communications in the United Kingdom, the European Union, North America, and internationally.
Good value with mediocre balance sheet.
Similar Companies
Market Insights


Advertisement
Weekly Picks
CE


Ceazar on Sparc AI ·
When GPS fails: this small cap is fixing a $54B drone problem
Fair Value:CA$5.2540.0% undervalued
89 followersusers have followed this narrative
0 commentsusers have commented on this narrative
22 likesusers have liked this narrative
HE


HedgeY on IonQ ·
The Best-Funded Quantum Platform and Still a Stock Priced for Perfection
Fair Value:US$482.3% overvalued
33 followersusers have followed this narrative
0 commentsusers have commented on this narrative
9 likesusers have liked this narrative
BL


BlackGoat on Cerebras Systems ·
The Wafer Giant Threatening NVIDIA's GPU Hegemony
Fair Value:US$415.5450.7% undervalued
56 followersusers have followed this narrative
1 commentusers have commented on this narrative
9 likesusers have liked this narrative
IV

Ivoed on Netflix ·
Netflix’s Business Quality Is Clear. The Harder Question Is Whether The Stock Is Still Cheap
Fair Value:US$825.3% undervalued
28 followersusers have followed this narrative
2 commentsusers have commented on this narrative
10 likesusers have liked this narrative
Recently Updated Narratives
KE


Kentaiga on Microsoft ·
Microsoft Are Industry Leaders at a Heavy Discount
Fair Value:US$50021.9% undervalued
1 followerusers have followed this narrative
0 commentsusers have commented on this narrative
0 likesusers have liked this narrative
IV

Ivoed on SBM Offshore ·
Why SBM Offshore’s €30 Share Price May Be Too Harsh On Its Backlog
Fair Value:€44.531.1% undervalued
1 followerusers have followed this narrative
0 commentsusers have commented on this narrative
0 likesusers have liked this narrative
AN


AntonioS on Medibank Private ·
Medibank Private Limited. No Margin of Safety!
Fair Value:AU$3.830.8% overvalued
1 followerusers have followed this narrative
0 commentsusers have commented on this narrative
0 likesusers have liked this narrative
Popular Narratives
IN


Investingwilly on Mastercard ·
Mastercard: The Best Dividend Stock You're Ignoring
Fair Value:US$75028.1% undervalued
83 followersusers have followed this narrative
1 commentusers have commented on this narrative
9 likesusers have liked this narrative
HA


HarishPK on Adobe ·
Adobe: A Probabilistic Case for Undervaluation
Fair Value:US$319.9631.3% undervalued
64 followersusers have followed this narrative
9 commentsusers have commented on this narrative
19 likesusers have liked this narrative
NI

niteco on Broadcom ·
A Capital Allocation Favorite with Structural Importance
Fair Value:US$651.0544.6% undervalued
56 followersusers have followed this narrative
0 commentsusers have commented on this narrative
13 likesusers have liked this narrative
Trending Discussion


MW

mwod31 on Greatland Resources ·
A great comment, WSB have not done the research imo. I intend to buy more shares in 2026.
0
|0