

Howard Marks put it nicely when he said that, rather than worrying about share price volatility, 'The possibility of permanent loss is the risk I worry about... and every practical investor I know worries about.' It's only natural to consider a company's balance sheet when you examine how risky it is, since debt is often involved when a business collapses. Importantly, Compass Group PLC (LON:CPG) does carry debt. But should shareholders be worried about its use of debt?
What Risk Does Debt Bring?
Debt is a tool to help businesses grow, but if a business is incapable of paying off its lenders, then it exists at their mercy. If things get really bad, the lenders can take control of the business. While that is not too common, we often do see indebted companies permanently diluting shareholders because lenders force them to raise capital at a distressed price. Having said that, the most common situation is where a company manages its debt reasonably well - and to its own advantage. When we examine debt levels, we first consider both cash and debt levels, together.
Check out our latest analysis for Compass Group
What Is Compass Group's Debt?
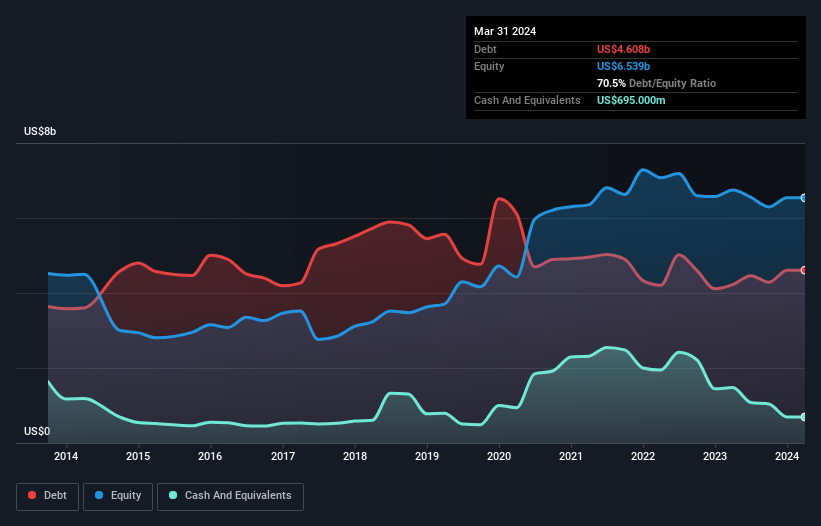
You can click the graphic below for the historical numbers, but it shows that as of March 2024 Compass Group had US$4.61b of debt, an increase on US$4.22b, over one year. However, it also had US$695.0m in cash, and so its net debt is US$3.91b.
How Healthy Is Compass Group's Balance Sheet?
Zooming in on the latest balance sheet data, we can see that Compass Group had liabilities of US$8.99b due within 12 months and liabilities of US$6.92b due beyond that. Offsetting these obligations, it had cash of US$695.0m as well as receivables valued at US$5.25b due within 12 months. So it has liabilities totalling US$9.97b more than its cash and near-term receivables, combined.
Compass Group has a very large market capitalization of US$47.8b, so it could very likely raise cash to ameliorate its balance sheet, if the need arose. However, it is still worthwhile taking a close look at its ability to pay off debt.
We use two main ratios to inform us about debt levels relative to earnings. The first is net debt divided by earnings before interest, tax, depreciation, and amortization (EBITDA), while the second is how many times its earnings before interest and tax (EBIT) covers its interest expense (or its interest cover, for short). This way, we consider both the absolute quantum of the debt, as well as the interest rates paid on it.
Compass Group's net debt is only 1.3 times its EBITDA. And its EBIT covers its interest expense a whopping 15.4 times over. So you could argue it is no more threatened by its debt than an elephant is by a mouse. Another good sign is that Compass Group has been able to increase its EBIT by 20% in twelve months, making it easier to pay down debt. There's no doubt that we learn most about debt from the balance sheet. But it is future earnings, more than anything, that will determine Compass Group's ability to maintain a healthy balance sheet going forward. So if you're focused on the future you can check out this free report showing analyst profit forecasts.
Finally, a business needs free cash flow to pay off debt; accounting profits just don't cut it. So we clearly need to look at whether that EBIT is leading to corresponding free cash flow. During the last three years, Compass Group produced sturdy free cash flow equating to 57% of its EBIT, about what we'd expect. This cold hard cash means it can reduce its debt when it wants to.
Our View
Happily, Compass Group's impressive interest cover implies it has the upper hand on its debt. And the good news does not stop there, as its EBIT growth rate also supports that impression! When we consider the range of factors above, it looks like Compass Group is pretty sensible with its use of debt. That means they are taking on a bit more risk, in the hope of boosting shareholder returns. When analysing debt levels, the balance sheet is the obvious place to start. However, not all investment risk resides within the balance sheet - far from it. Be aware that Compass Group is showing 1 warning sign in our investment analysis , you should know about...
If you're interested in investing in businesses that can grow profits without the burden of debt, then check out this free list of growing businesses that have net cash on the balance sheet.
If you're looking to trade Compass Group, open an account with the lowest-cost platform trusted by professionals, Interactive Brokers.
With clients in over 200 countries and territories, and access to 160 markets, IBKR lets you trade stocks, options, futures, forex, bonds and funds from a single integrated account.
Enjoy no hidden fees, no account minimums, and FX conversion rates as low as 0.03%, far better than what most brokers offer.
Sponsored ContentNew: AI Stock Screener & Alerts
Our new AI Stock Screener scans the market every day to uncover opportunities.
• Dividend Powerhouses (3%+ Yield)
• Undervalued Small Caps with Insider Buying
• High growth Tech and AI Companies
Or build your own from over 50 metrics.
Have feedback on this article? Concerned about the content? Get in touch with us directly. Alternatively, email editorial-team (at) simplywallst.com.
This article by Simply Wall St is general in nature. We provide commentary based on historical data and analyst forecasts only using an unbiased methodology and our articles are not intended to be financial advice. It does not constitute a recommendation to buy or sell any stock, and does not take account of your objectives, or your financial situation. We aim to bring you long-term focused analysis driven by fundamental data. Note that our analysis may not factor in the latest price-sensitive company announcements or qualitative material. Simply Wall St has no position in any stocks mentioned.
About LSE:CPG
Compass Group
Provides food and support services in North America, Europe, Asia Pacific, and internationally.
Reasonable growth potential with adequate balance sheet.
Similar Companies
Market Insights

Community Narratives
