

David Iben put it well when he said, 'Volatility is not a risk we care about. What we care about is avoiding the permanent loss of capital.' When we think about how risky a company is, we always like to look at its use of debt, since debt overload can lead to ruin. Importantly, Travis Perkins plc (LON:TPK) does carry debt. But the more important question is: how much risk is that debt creating?
When Is Debt A Problem?
Debt assists a business until the business has trouble paying it off, either with new capital or with free cash flow. In the worst case scenario, a company can go bankrupt if it cannot pay its creditors. However, a more usual (but still expensive) situation is where a company must dilute shareholders at a cheap share price simply to get debt under control. Of course, the upside of debt is that it often represents cheap capital, especially when it replaces dilution in a company with the ability to reinvest at high rates of return. When we examine debt levels, we first consider both cash and debt levels, together.
See our latest analysis for Travis Perkins
What Is Travis Perkins's Net Debt?
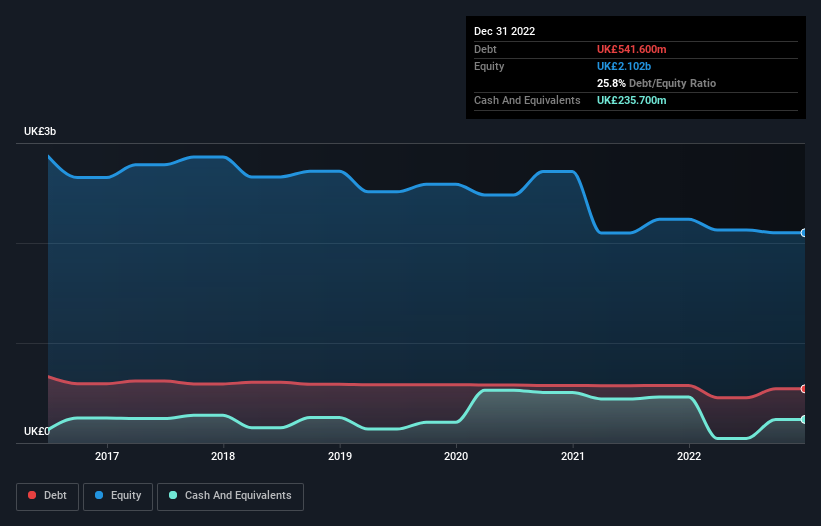
As you can see below, Travis Perkins had UK£541.6m of debt at December 2022, down from UK£575.2m a year prior. However, it does have UK£235.7m in cash offsetting this, leading to net debt of about UK£305.9m.
A Look At Travis Perkins' Liabilities
The latest balance sheet data shows that Travis Perkins had liabilities of UK£1.15b due within a year, and liabilities of UK£888.3m falling due after that. Offsetting these obligations, it had cash of UK£235.7m as well as receivables valued at UK£688.4m due within 12 months. So its liabilities total UK£1.11b more than the combination of its cash and short-term receivables.
Travis Perkins has a market capitalization of UK£2.01b, so it could very likely raise cash to ameliorate its balance sheet, if the need arose. However, it is still worthwhile taking a close look at its ability to pay off debt.
In order to size up a company's debt relative to its earnings, we calculate its net debt divided by its earnings before interest, tax, depreciation, and amortization (EBITDA) and its earnings before interest and tax (EBIT) divided by its interest expense (its interest cover). Thus we consider debt relative to earnings both with and without depreciation and amortization expenses.
Looking at its net debt to EBITDA of 0.88 and interest cover of 5.9 times, it seems to us that Travis Perkins is probably using debt in a pretty reasonable way. But the interest payments are certainly sufficient to have us thinking about how affordable its debt is. The bad news is that Travis Perkins saw its EBIT decline by 12% over the last year. If that sort of decline is not arrested, then the managing its debt will be harder than selling broccoli flavoured ice-cream for a premium. The balance sheet is clearly the area to focus on when you are analysing debt. But it is future earnings, more than anything, that will determine Travis Perkins's ability to maintain a healthy balance sheet going forward. So if you're focused on the future you can check out this free report showing analyst profit forecasts.
Finally, a business needs free cash flow to pay off debt; accounting profits just don't cut it. So the logical step is to look at the proportion of that EBIT that is matched by actual free cash flow. Over the last three years, Travis Perkins actually produced more free cash flow than EBIT. That sort of strong cash conversion gets us as excited as the crowd when the beat drops at a Daft Punk concert.
Our View
When it comes to the balance sheet, the standout positive for Travis Perkins was the fact that it seems able to convert EBIT to free cash flow confidently. However, our other observations weren't so heartening. In particular, EBIT growth rate gives us cold feet. Looking at all this data makes us feel a little cautious about Travis Perkins's debt levels. While we appreciate debt can enhance returns on equity, we'd suggest that shareholders keep close watch on its debt levels, lest they increase. The balance sheet is clearly the area to focus on when you are analysing debt. But ultimately, every company can contain risks that exist outside of the balance sheet. For instance, we've identified 1 warning sign for Travis Perkins that you should be aware of.
If you're interested in investing in businesses that can grow profits without the burden of debt, then check out this free list of growing businesses that have net cash on the balance sheet.
If you're looking to trade Travis Perkins, open an account with the lowest-cost platform trusted by professionals, Interactive Brokers.
With clients in over 200 countries and territories, and access to 160 markets, IBKR lets you trade stocks, options, futures, forex, bonds and funds from a single integrated account.
Enjoy no hidden fees, no account minimums, and FX conversion rates as low as 0.03%, far better than what most brokers offer.
Sponsored ContentValuation is complex, but we're here to simplify it.
Discover if Travis Perkins might be undervalued or overvalued with our detailed analysis, featuring fair value estimates, potential risks, dividends, insider trades, and its financial condition.
Access Free AnalysisHave feedback on this article? Concerned about the content? Get in touch with us directly. Alternatively, email editorial-team (at) simplywallst.com.
This article by Simply Wall St is general in nature. We provide commentary based on historical data and analyst forecasts only using an unbiased methodology and our articles are not intended to be financial advice. It does not constitute a recommendation to buy or sell any stock, and does not take account of your objectives, or your financial situation. We aim to bring you long-term focused analysis driven by fundamental data. Note that our analysis may not factor in the latest price-sensitive company announcements or qualitative material. Simply Wall St has no position in any stocks mentioned.
About LSE:TPK
Travis Perkins
Engages in distribution of building material products in the United Kingdom.
Flawless balance sheet and undervalued.
Similar Companies
Market Insights

Community Narratives
