
Advertisement
- United Kingdom
- /
- Banks
- /
- LSE:STB
The total return for Secure Trust Bank (LON:STB) investors has risen faster than earnings growth over the last five years
The Secure Trust Bank PLC (LON:STB) share price has had a bad week, falling 23%. But at least the stock is up over the last five years. Unfortunately its return of 43% is below the market return of 76%.
Although Secure Trust Bank has shed UK£51m from its market cap this week, let's take a look at its longer term fundamental trends and see if they've driven returns.
While the efficient markets hypothesis continues to be taught by some, it has been proven that markets are over-reactive dynamic systems, and investors are not always rational. One imperfect but simple way to consider how the market perception of a company has shifted is to compare the change in the earnings per share (EPS) with the share price movement.
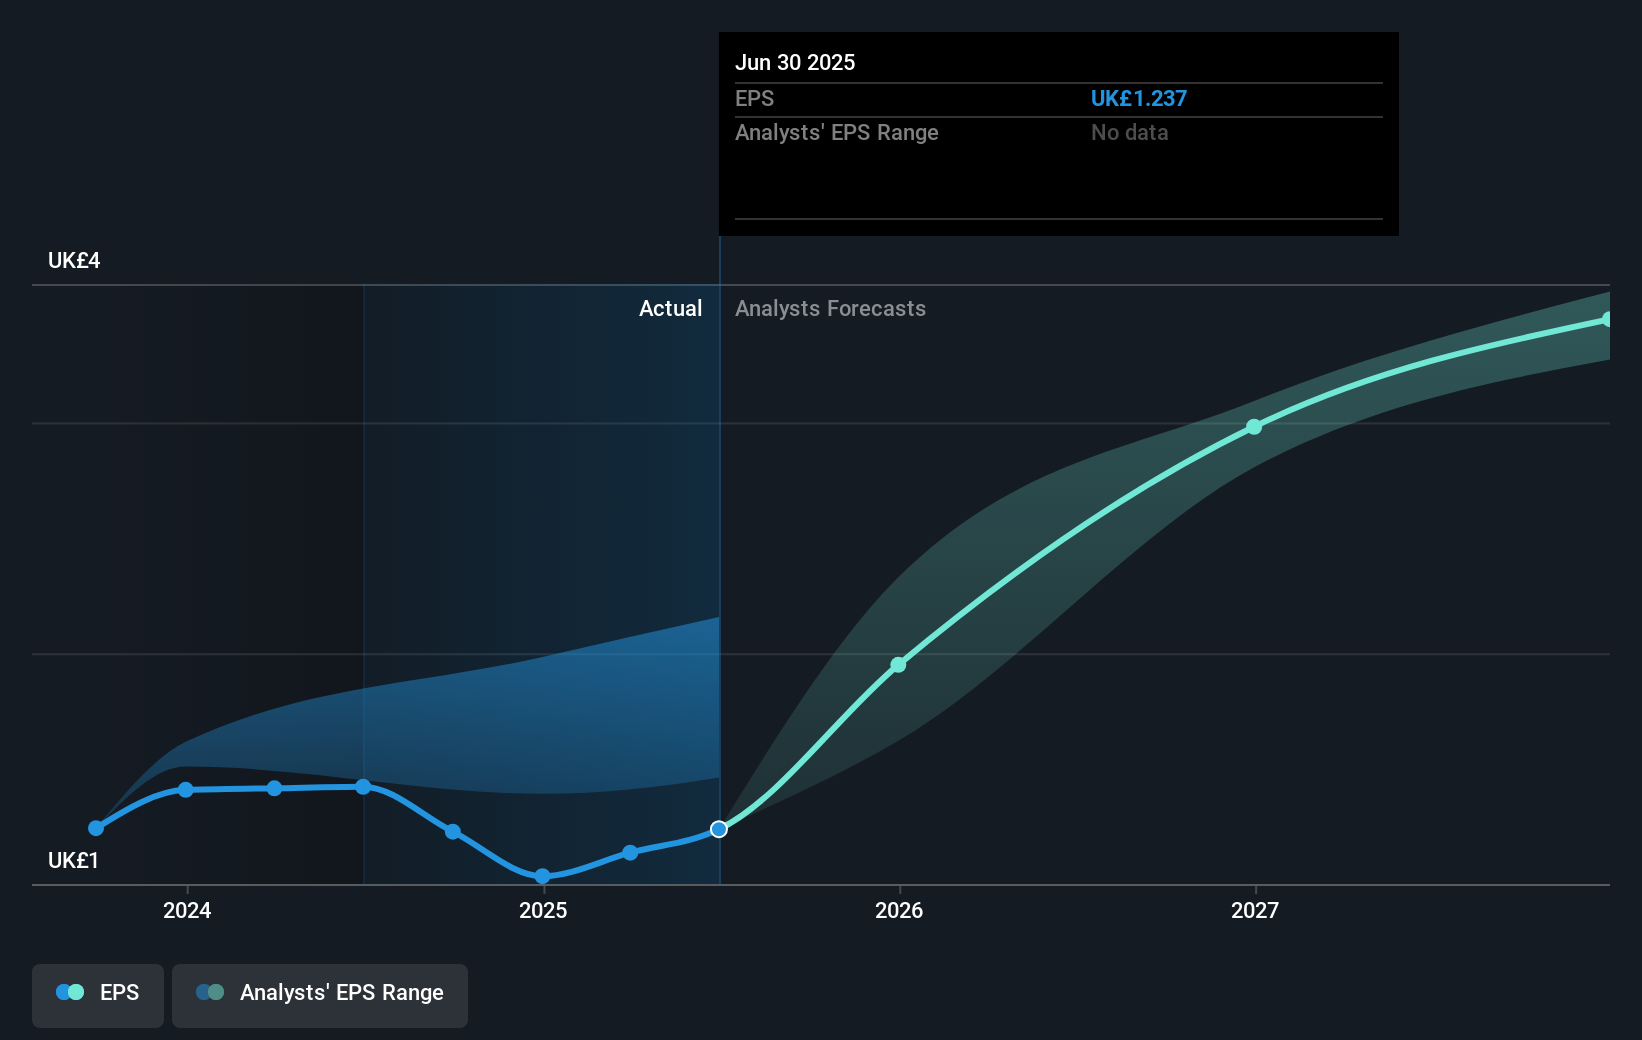
During five years of share price growth, Secure Trust Bank achieved compound earnings per share (EPS) growth of 2.4% per year. This EPS growth is lower than the 7% average annual increase in the share price. So it's fair to assume the market has a higher opinion of the business than it did five years ago. And that's hardly shocking given the track record of growth.
The company's earnings per share (over time) is depicted in the image below (click to see the exact numbers).
It's probably worth noting we've seen significant insider buying in the last quarter, which we consider a positive. On the other hand, we think the revenue and earnings trends are much more meaningful measures of the business. It might be well worthwhile taking a look at our free report on Secure Trust Bank's earnings, revenue and cash flow.
What About Dividends?
It is important to consider the total shareholder return, as well as the share price return, for any given stock. Whereas the share price return only reflects the change in the share price, the TSR includes the value of dividends (assuming they were reinvested) and the benefit of any discounted capital raising or spin-off. It's fair to say that the TSR gives a more complete picture for stocks that pay a dividend. As it happens, Secure Trust Bank's TSR for the last 5 years was 85%, which exceeds the share price return mentioned earlier. And there's no prize for guessing that the dividend payments largely explain the divergence!
A Different Perspective
Secure Trust Bank shareholders have received returns of 18% over twelve months (even including dividends), which isn't far from the general market return. That gain looks pretty satisfying, and it is even better than the five-year TSR of 13% per year. Even if the share price growth slows down from here, there's a good chance that this is business worth watching in the long term. While it is well worth considering the different impacts that market conditions can have on the share price, there are other factors that are even more important. Even so, be aware that Secure Trust Bank is showing 3 warning signs in our investment analysis , you should know about...
Secure Trust Bank is not the only stock insiders are buying. So take a peek at this free list of small cap companies at attractive valuations which insiders have been buying.
Please note, the market returns quoted in this article reflect the market weighted average returns of stocks that currently trade on British exchanges.
New: Manage All Your Stock Portfolios in One Place
We've created the ultimate portfolio companion for stock investors, and it's free.
• Connect an unlimited number of Portfolios and see your total in one currency
• Be alerted to new Warning Signs or Risks via email or mobile
• Track the Fair Value of your stocks
Have feedback on this article? Concerned about the content? Get in touch with us directly. Alternatively, email editorial-team (at) simplywallst.com.
This article by Simply Wall St is general in nature. We provide commentary based on historical data and analyst forecasts only using an unbiased methodology and our articles are not intended to be financial advice. It does not constitute a recommendation to buy or sell any stock, and does not take account of your objectives, or your financial situation. We aim to bring you long-term focused analysis driven by fundamental data. Note that our analysis may not factor in the latest price-sensitive company announcements or qualitative material. Simply Wall St has no position in any stocks mentioned.
About LSE:STB
Secure Trust Bank
Provides banking and financial products and services in the United Kingdom.
Undervalued with reasonable growth potential.
Similar Companies
Market Insights

Advertisement
Community Narratives
A formidable player in AI and enterprise computing.
Fair Value US$210.00|3.9% overvalued
CO
Community Contributor
IREN's Bold Moves in Sustainable Bitcoin Mining & AI Data Centers
Fair Value US$89.00|21.8% undervalued
BL
Community Contributor
Cooling the Champions: The Aussie Tech Behind F1's Victories
Fair Value AU$12.40|39.4% undervalued
TR
Community Contributor